WaterAid
Things used in this project
Hardware components

|
Arduino MKR GSM 1400 | × 1 |

|
NeoPixel Ring: WS2812 5050 RGB LED | × 1 |
| GY21 Temperature and Humidity | × 1 | |

|
Turbidity Sensor, Phototransistor Output | × 1 |

|
Adafruit Waterproof DS18B20 Digital temperature sensor | × 1 |

|
Gravity: Analog Spear Tip pH Sensor / Meter Kit | × 1 |

|
Pushbutton switch 12mm | × 1 |

|
Jumper wires (generic) | × 1 |

|
Resistor 220 ohm | × 1 |
Software apps and online services

|
Arduino Web Editor | × 1 |

|
SORACOM Air IoT Connectivity Platform | × 1 |

|
SORACOM Harvest | × 1 |

|
SORACOM Lagoon | × 1 |
Hand tools and fabrication machines

|
Soldering iron (generic) | × 1 |
Story
Overview
Rivers. Essential to our survival, trade and so on. Great efforts have been made in the last decade to reduce our pollution of the world's bodies of water. The rivers are the source of the pollution, as people do not go to the sea to dump their trash. They dump it in the rivers.
These rivers then spill into the sea, the ocean and so the toothbrush that was once thrown in a river makes its way across the world and lands on the other side of it.
In a world trying to combat pollution, data is crucial. It should be easy for companies and businesses to collaborate on a global project to reduce water pollution. This is where UnifiedWater comes in.
A device cheap enough and scalable that can easily collect and analyse this data, so necessary to know how polluted a river is. WaterAid comes in 2 modes, one that would fit enterprises and another for individuals.
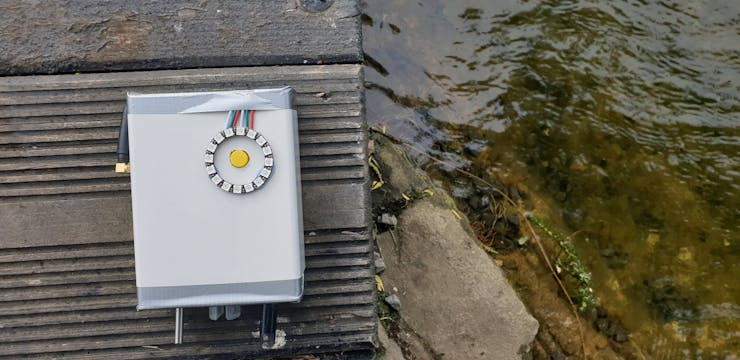
Multiple devices can function together, placed at different points across a stream or in different bodies of water. These devices collect data at an interval of time sending it to the same database. This allows the business to check the status of the river or lake being monitored with the click of a button.
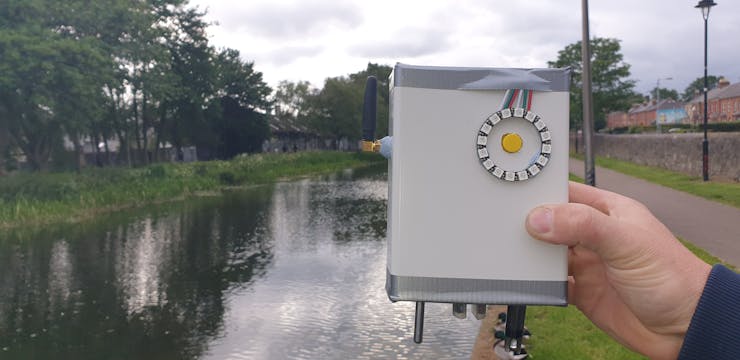
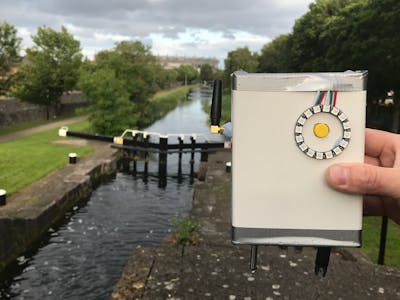
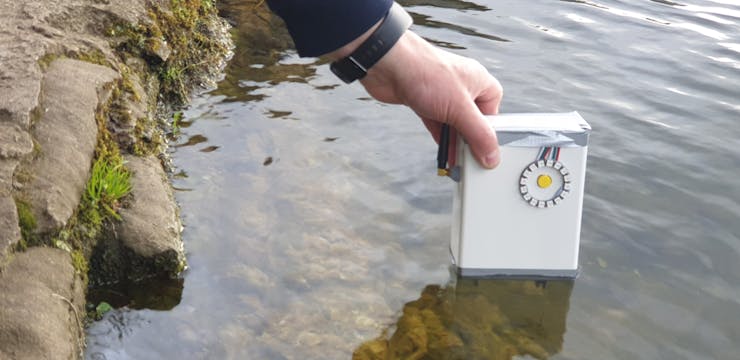
A portable version of the device is also available. In this version, the individual can carry the device with them and when they wish to take a water sample, they press on a button on the device and place it in water for 30 seconds. The data will then be available on an online dashboard.
By collecting water temperature, pH and humidity as well as atmospheric temperature and humidity, WaterAid is packed with all the sensors you would need to monitor the pollution of the river.
VideoImages
Functionality
WaterAid allows the user, a company or an individual to collect data safely and accurately and visualise all this data in one place thanks to Soracom's cloud. The project is composed of a front end and a backend.
Front EndThe front end of the project is the physical device that is used to collect the data and send it to the cloud. The device can be set into mode 1 or 2. In mode 1, the device records a set of data with the press of a button, useful for occasional monitoring of a body of water. Mode 2 sets the device to take readings at a defined interval of time and push this data to the cloud.
An MKR GSM is used for the front end as it is easy to use and reliable. It can also access Soracom through GSM. Below are the steps taken by the device when collecting data.
The device is firstly in setup mode, it synchs the onboard RTC to the epoch time received from the GSM network, initialises libraries used and gets a lock on the location.
Firstly the trigger event occurs, the device is either woken up after sleeping for an amount of time (mode 2) or has been waken up by the press of a button (mode 1).
The device then takes readings from its array of sensors measuring water temperature, pH and turbidity as well as atmospheric temperature and humidity.
The time and geolocation are then extracted from the MKR GSM's network.
The data is then all parsed into a buffer formatted accordingly.
Lastly the data is sent to Soracom's cloud through Soracom Air.

 Battery
The device can be powered through multiple ways. It can be powered by a LiPo battery through the provided port on the device, by a power bank or by connecting a battery through the VIN port on the device.
The lifetime of the device heavily relies on the power of the battery. The device goes into sleep mode between reads to conserve as much energy as possible.
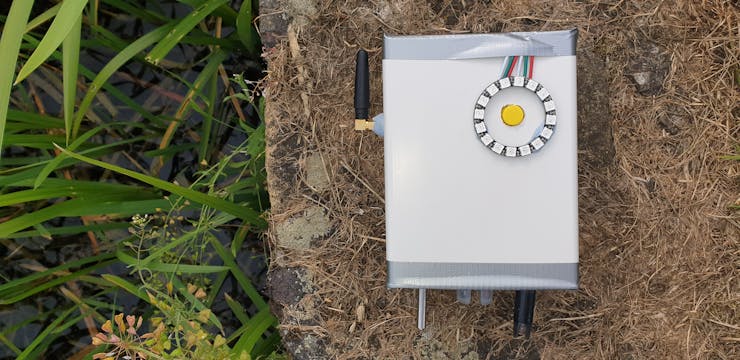
LED RingThe device is also equipped with an LED ring. This provides the user with feedback on what the device is doing at the moment. There are 3 modes that the ring can be in.
Multicolour indicates that the device is setting up or is processing dataFlashing Red a warning, usually meaning that the device has to be placed in water though it could also indicate an errorProgressing Blue or Green indicates that the device is currently taking a sample and should be placed in water.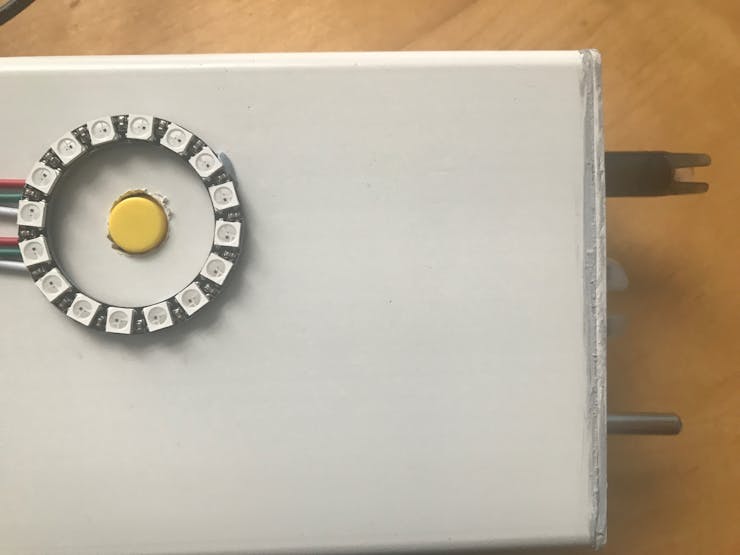 Takinga Sample
The device's sensors should all be placed in the water when the device is taking a sample. A 6 second delay is placed before the sample is taken to warm up the sensors. For best results, the sensors should be submerged when the warm-up is taking place.
 Parsing Data
The Data has to be sent to Soracom in the form of a JSON string. This gives all the keys used a value. The data will then be easy to interpret by the backend. Below is an example of a payload that would be sent.
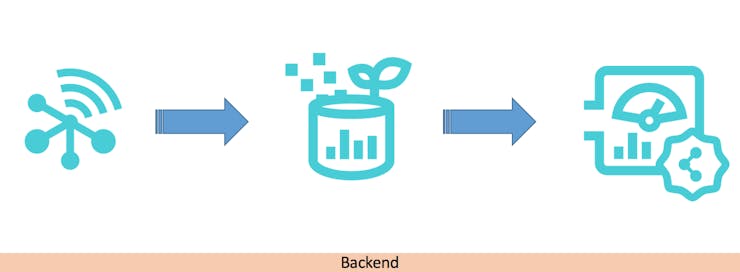
{ "Latitude":53.3474617, "Longitude":-6.2514529, "waterpH":7.30, "waterTurbidity":94, "waterTemp":12.10, "atmoTemp":14.50, "atmoHum":82, "deviceID":1, "deviceName":"device1", "epoch":1559392636, "mode":2 }The BackendThe backend of the project refers to Soracom. Data is collected and visualised in the backend on dashboards. These dashboards are created using Soracom Lagoon.
Data is received by Soracom Air from the device
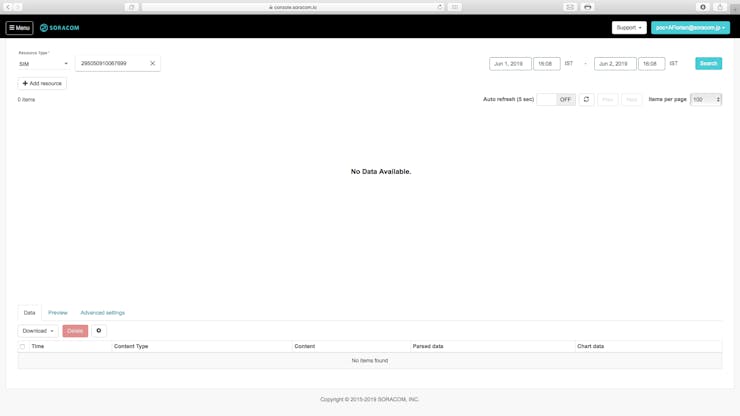
The data is then extracted using Soracom Harvest
The data is finally queried by Soracom Lagoon at intervals of time which then displays the data on a dashboard.
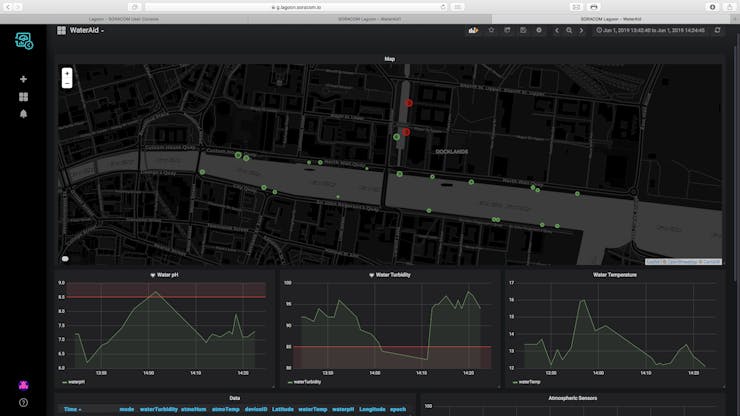
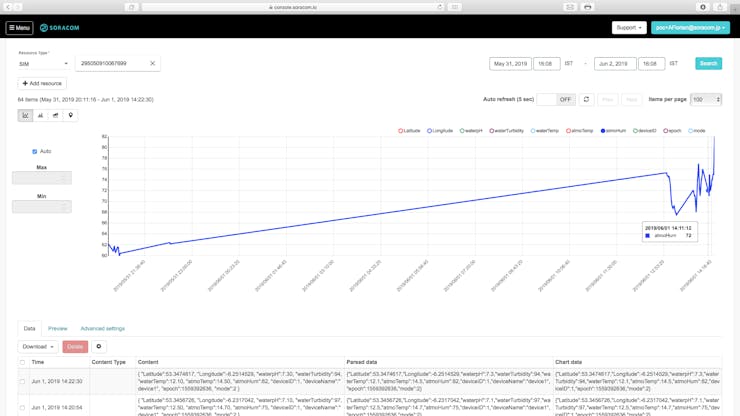
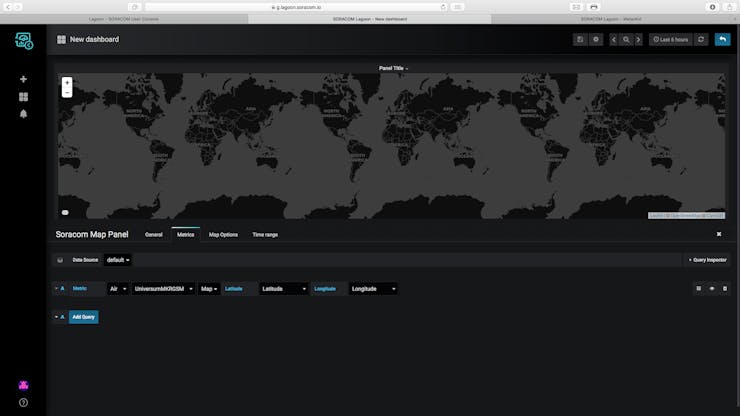
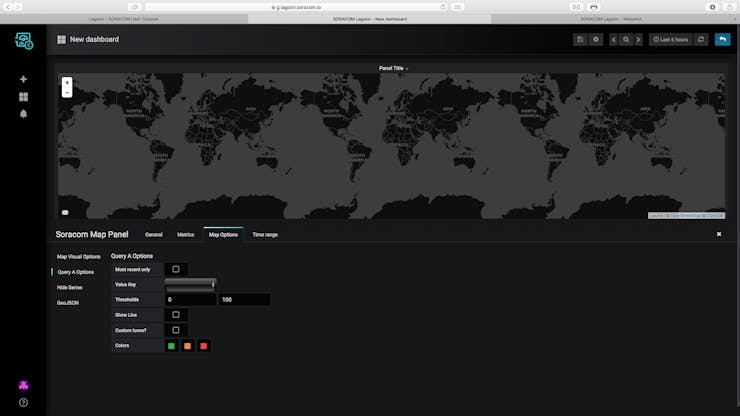
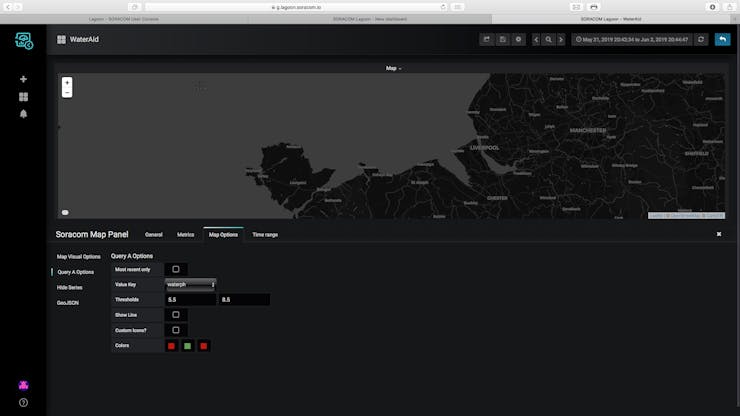
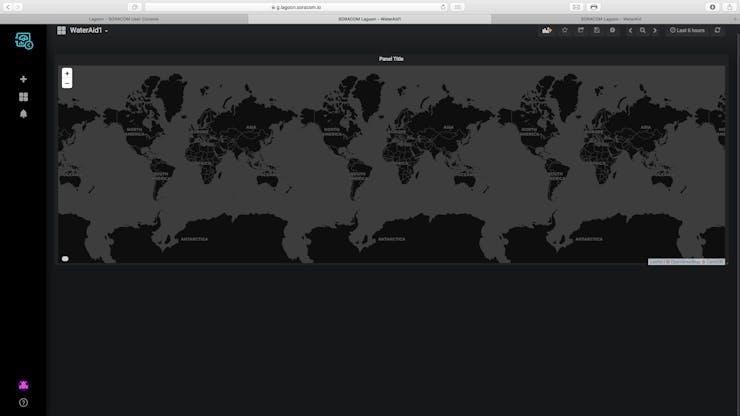
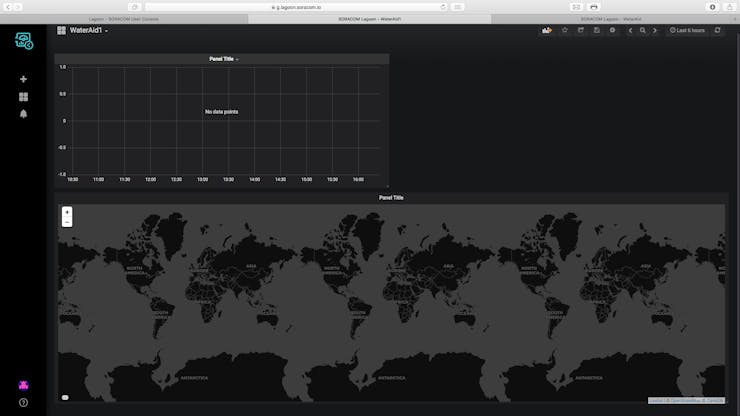
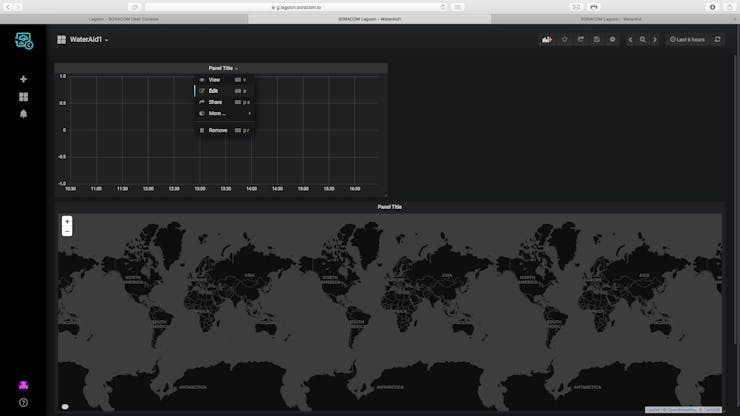
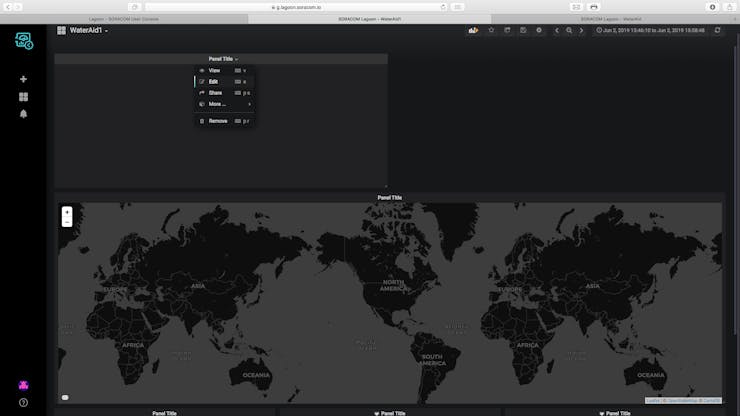
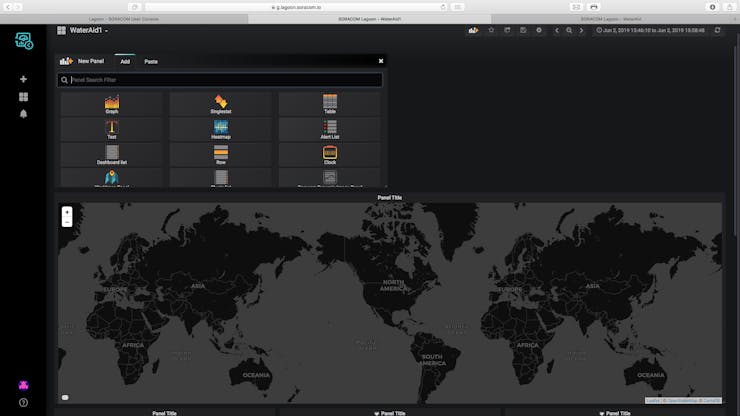
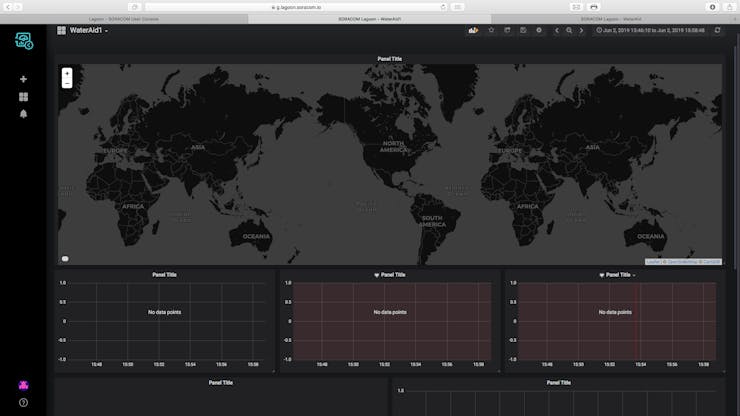
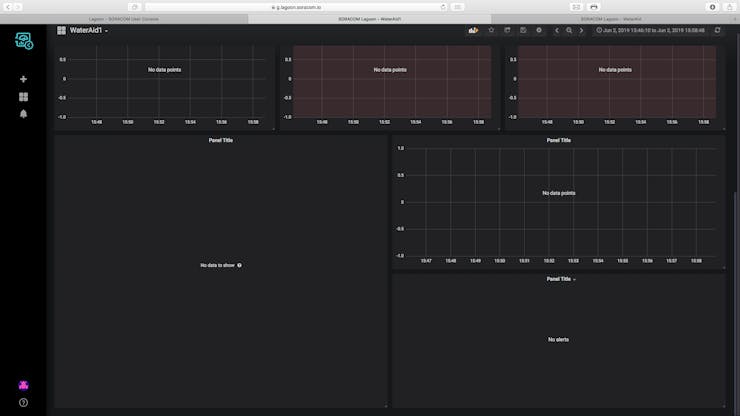
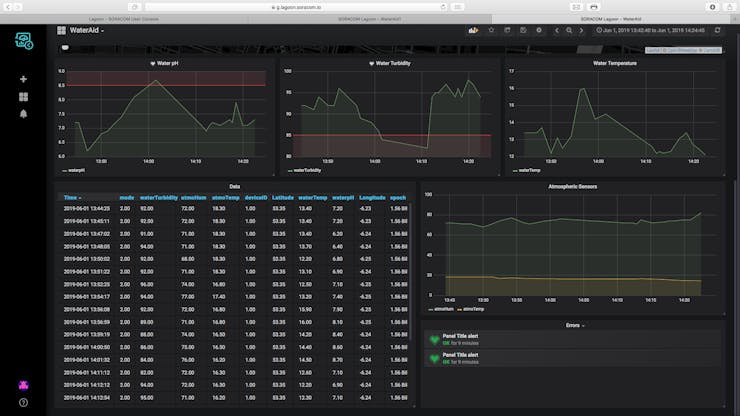
 The Dashboard
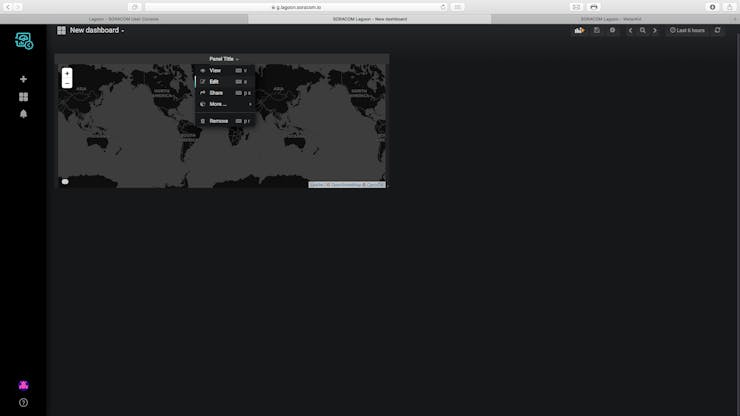
The dashboard sums up all the data collected from the device. It plots the places data was collected from on a map, the colour varies according to how polluted the water is. The data is then graphed on line graphs below that and is then fully summed up on a table.
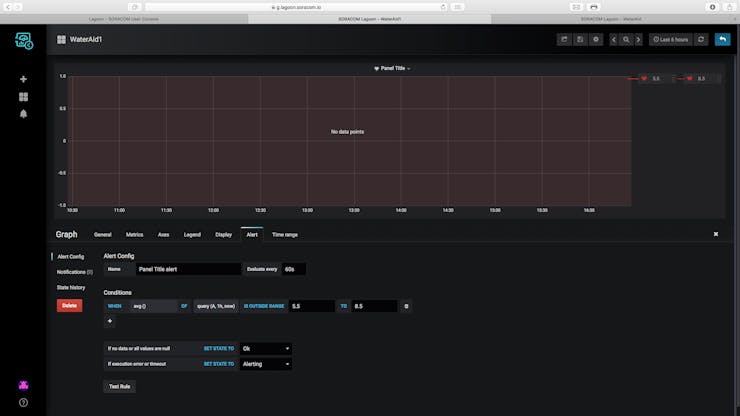
The user will also get alerts through email if the value of the pH or turbidity of the water are abnormal. Below are some screenshots of the dashboard.

 Scalability
The device can be easily scalable and all data can be collected and illustrated on the same dashboard. Multiple devices can stream data to the Soracom and have the data visualised on the dashboard.
The price of the device and the extreme ease to build and program it makes it easy for a fleet of devices to be used. These devices can also easily be registered into Soracom using tools like Soracom Krypton.Each enterprise or individual will have their personalised dashboard where the data collected by their devices will be visualised. Hopefully, people will be able to collaborate on the same dashboard and share their data with each other in the near future.
Benefits
The individual or company utilising this product will benefit in:
Constructing the Project
Step 1: Required ApparatusThis project requires a lot of sensors that will monitor a lot of parameters related to the water and the atmosphere placed in. Below is a list of all the materials needed.
1, Arduino MKR GSM1, 16 LEDs RGB LED ring1, GY-21 temperature and humidity module1, Turbidity sensor1, Waterproof temperature sensor1, pH sensor and module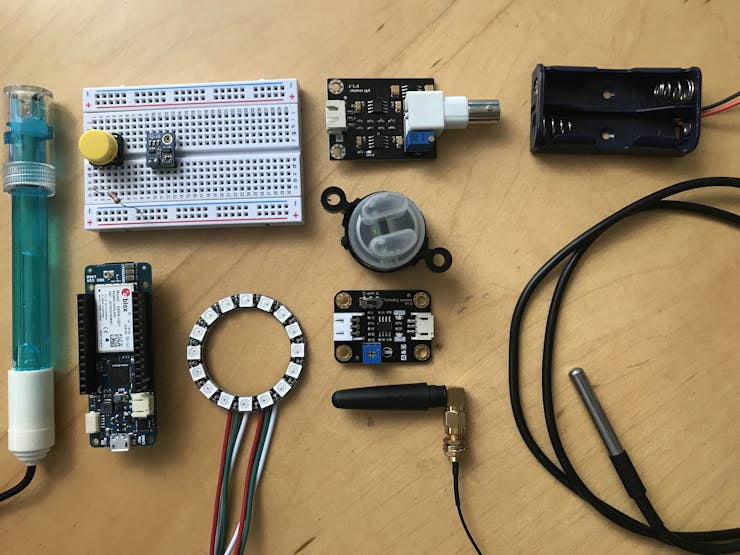 Step 2: Connecting the Circuit
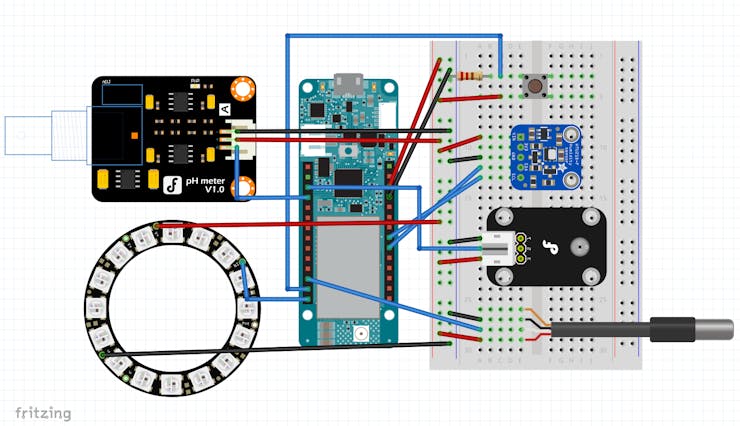
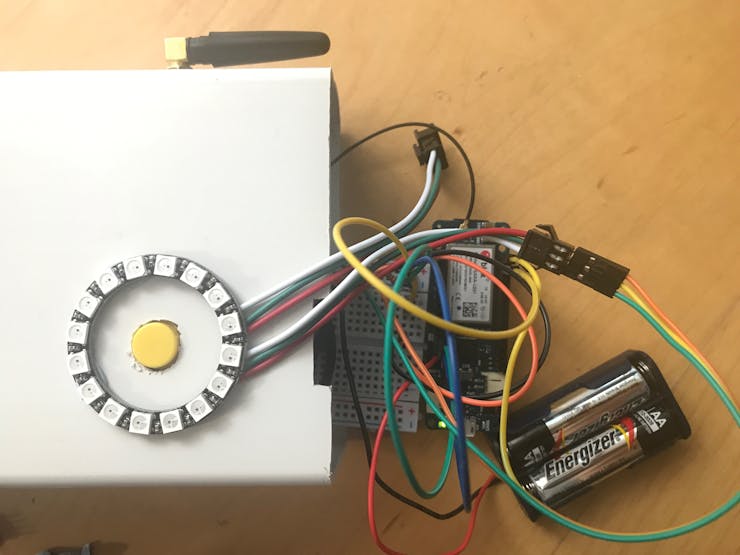
The components should be soldered together. To ease the understanding of the schematics out, a breadboard has been used. the schematics are below.
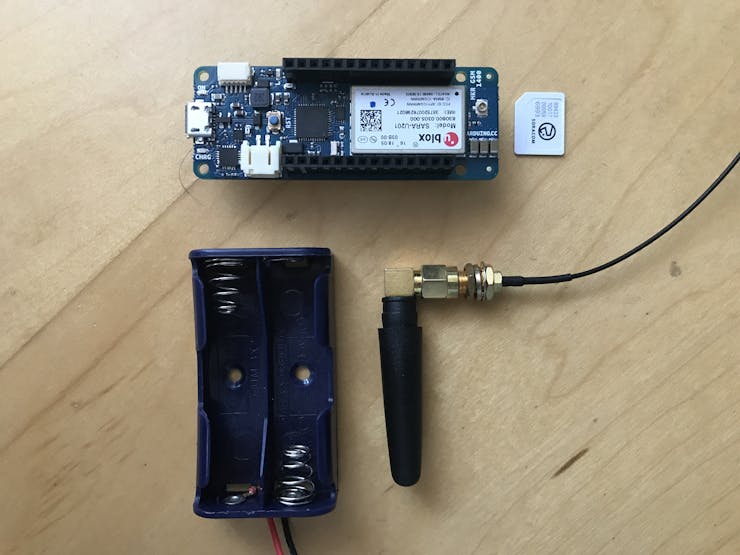
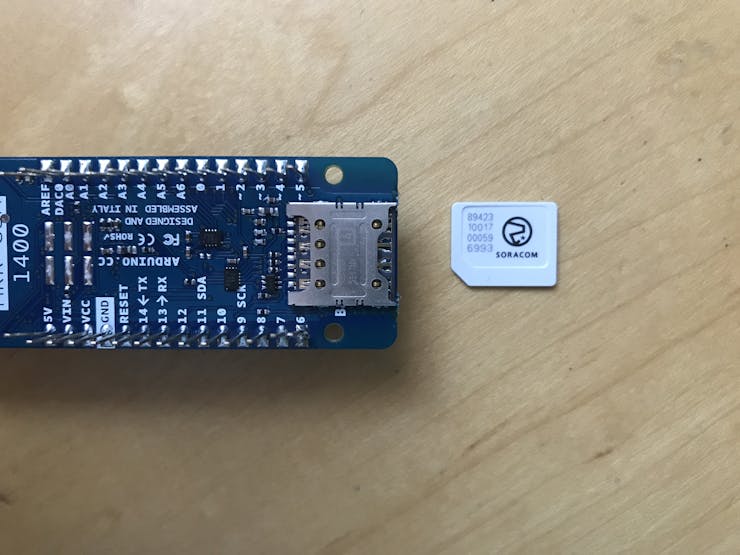
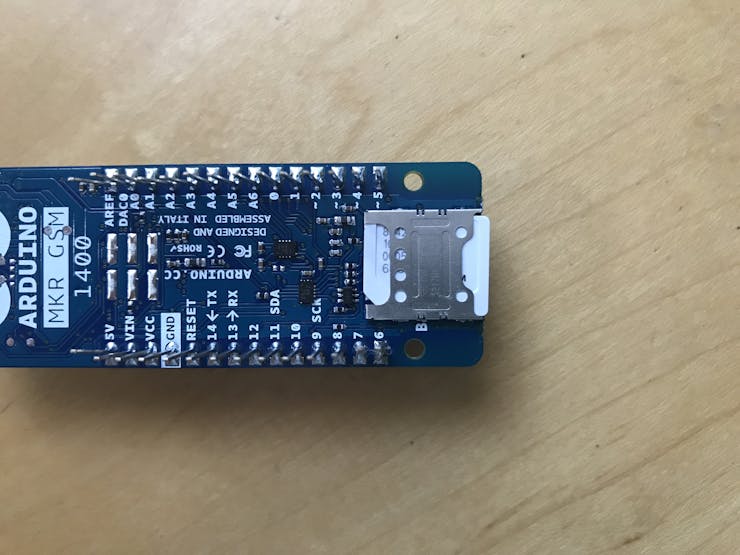
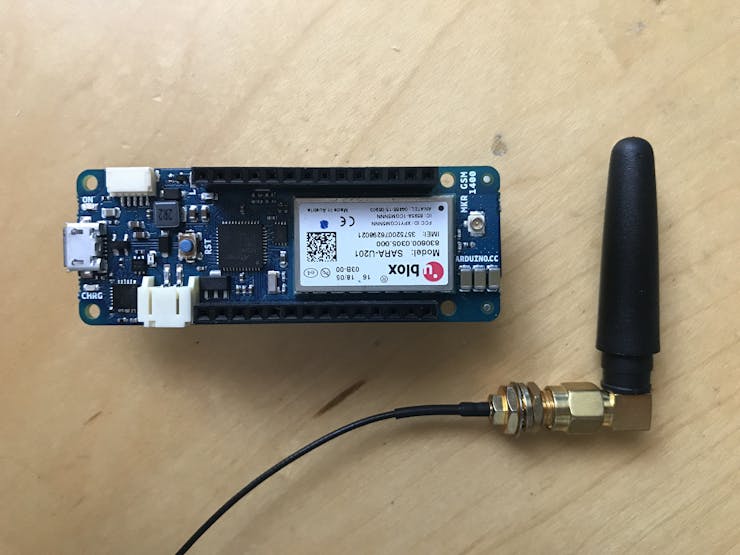
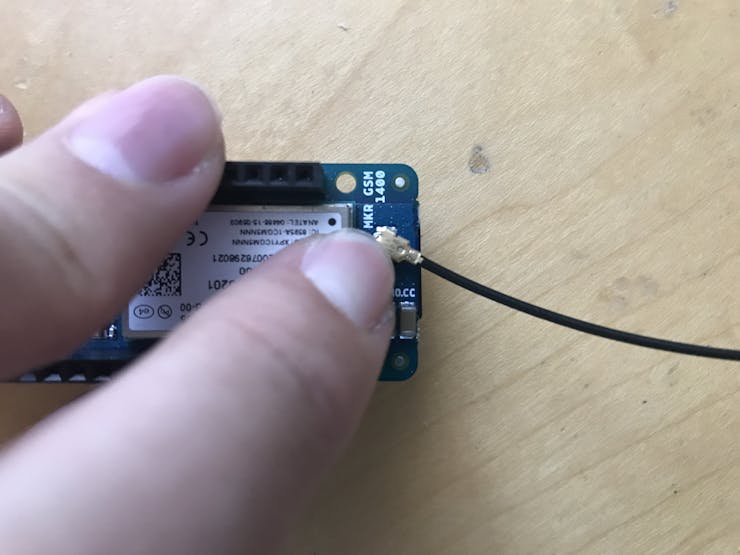
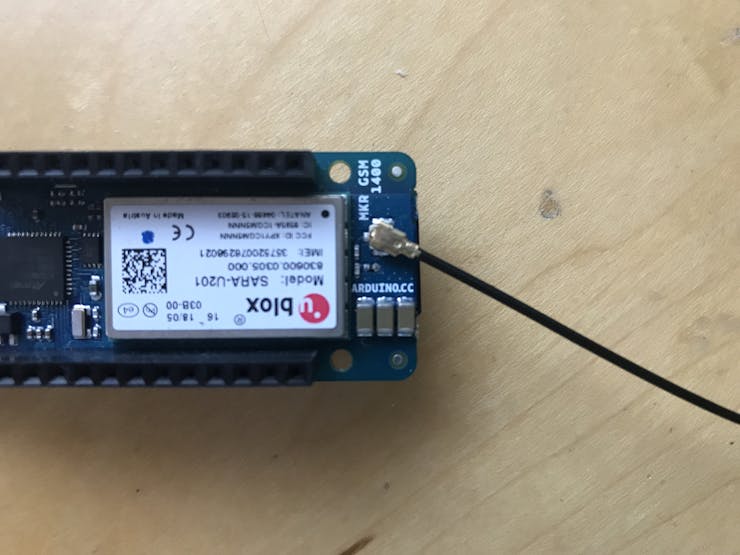
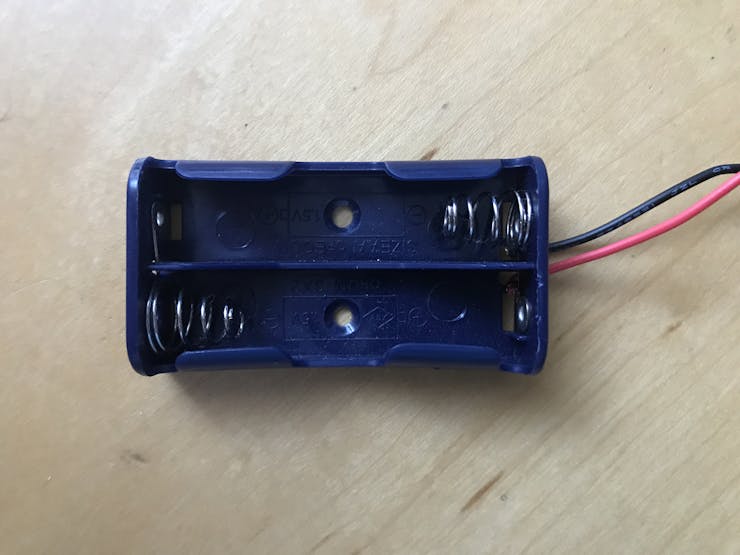
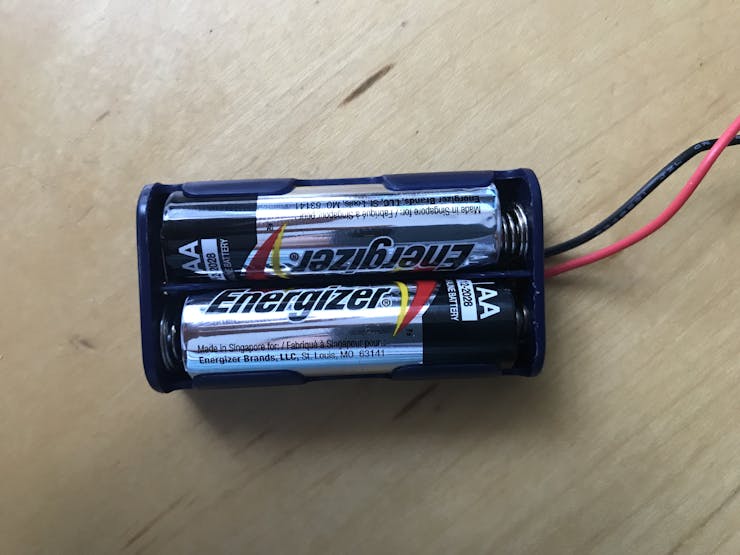
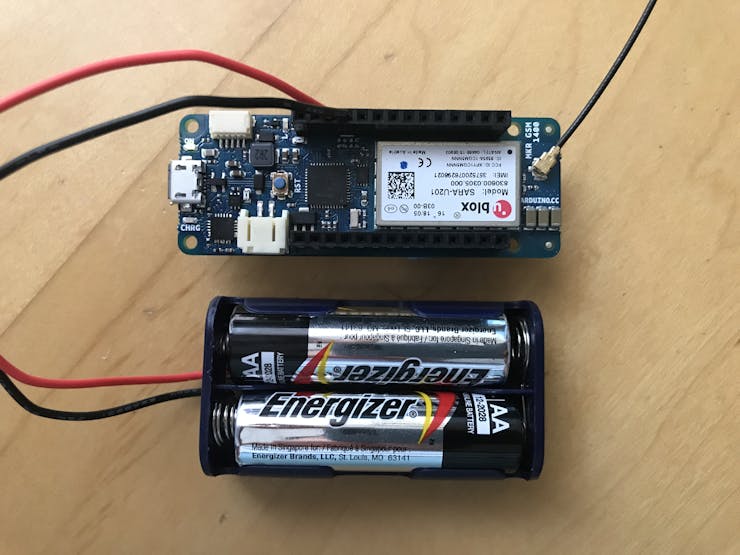
 Preparing the MKR GSM
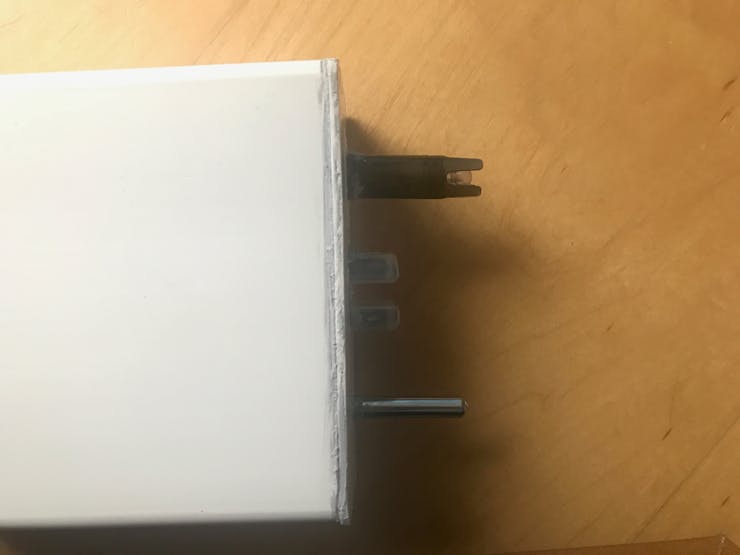
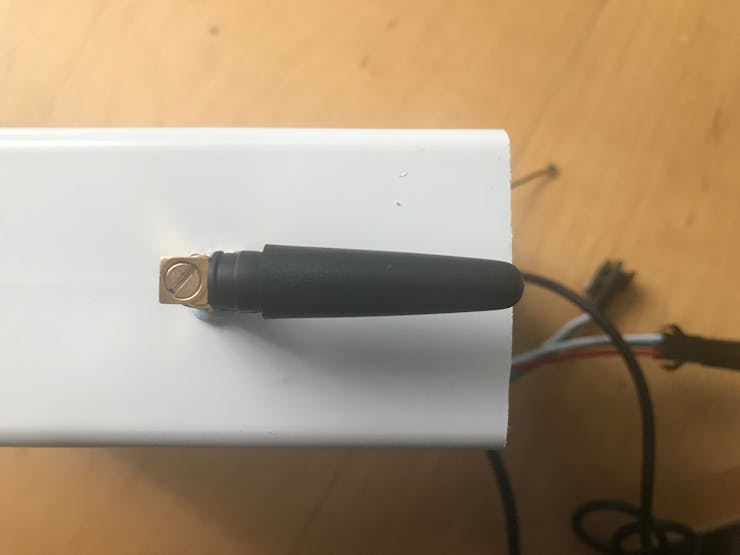
After the sensors have been soldered to the device, the SIM card, GSM antenna and battery have to be attached to the device. I am powering the board with 2 AA batteries through the VIN port. The steps are below.
 Step 3: Acknowledging the Code
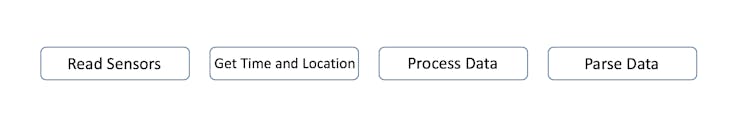
There are 4 main sections to the code of the project.
All these sections are described and detailed below.
Collect Sensor DataSerial.println("Taking Sample"); Serial.println("________________________________________"); Serial.println("Taking Sample"); Serial.println(" OK - Warming Up"); delay(6000); // delay for sensor calibration colourLED(50); Serial.println(" OK - Taking Sample"); Serial.print(" "); for (int i = 0; i < 16; i++) { if (mode == 1) { strip.setPixelColor(i, strip.Color(0, 255, 0)); strip.show(); } else { strip.setPixelColor(i, strip.Color(0, 0, 255)); strip.show(); } // going to take multiple water samples - sensors not that precise waterTurbidity += getWaterTurbidity(); waterPh += getWaterPh(); if (i > 14) { // take a single sample for high precision sensors waterTemperature = getWaterTemp(); atmoTemperature = getAtmoTemp(); atmoHumidity = getAtmoHumidity(); } Serial.print("."); delay(500); } Serial.println(""); Serial.println(" Success - Samples Taken"); for (int i = 0; i <= 16; i++) { strip.setPixelColor(i, strip.Color(0, 0, 0)); strip.show(); delay(30); } Serial.println("________________________________________"); Serial.println(""); delay(500);The section of code above starts off by waiting 6 seconds for the sensors to calibrate in the water. The device then loops for 16 times, a new LED turning on the ring every loop.
Data from sensors that have fluctuating values is collected 16 times and then the mean is found. The high precision sensors are read on the last loop.
Get Time and Datevoid getCredentials(){ Serial.println(" [1/2] Time"); Serial.println(" OK - Getting Time from RTC"); currentEpoch = processTime(); colourLED(50); Serial.println(" [2/2] Geolocation"); Serial.println(" OK - Getting Geolocation from GPRS"); while (!getLocation()); Serial.print(" Success - Geolocation is "); Serial.print(latitude, 7); Serial.print(", "); Serial.println(longitude, 7); colourLED(50);} bool getLocation(){ if (location.available()) { latitude = location.latitude(); longitude = location.longitude(); delay(500); return true; } else { delay(500); return false; }}The first loop handles the credentials. The time is extracted from the onboard RTC as it was synched to the GSM network in setup. The geolocation is extracted from GPRS.
Process Datavoid processData(){ Serial.println(" OK - Getting Mean of Water pH and Turbidity"); waterPh = (waterPh / 16); waterTurbidity = (waterTurbidity / 16); Serial.println(" OK - Dumping Data to Serial"); Serial.println(""); Serial.print(" [Water] pH "); Serial.println(waterPh); Serial.print(" [Water] Turbidity "); Serial.println(waterTurbidity); Serial.print(" [Water] Temperature "); Serial.println(waterTemperature); Serial.print(" [Atmo] Temperature "); Serial.println(atmoTemperature); Serial.print(" [Atmo] Humidity "); Serial.println(atmoHumidity); Serial.println(""); Serial.println(" Success - Data Processed"); colourLED(50);} String makeLine(){ Serial.println(" OK - Making String"); String dataReturned; dataReturned += "{"; dataReturned += " \n"; dataReturned += "\"Latitude\":" + String(latitude, 7); dataReturned += ", \n"; dataReturned += "\"Longitude\":" + String(longitude, 7); dataReturned += ", \n"; dataReturned += "\"waterpH\":" + String(waterPh); dataReturned += ", \n"; dataReturned += "\"waterTurbidity\":" + String(waterTurbidity); dataReturned += ", \n"; dataReturned += "\"waterTemp\":" + String(waterTemperature); dataReturned += ", \n"; dataReturned += "\"atmoTemp\":" + String(atmoTemperature); dataReturned += ", \n"; dataReturned += "\"atmoHum\":" + String(atmoHumidity); dataReturned += ", \n"; dataReturned += "\"deviceID\":" + String(deviceID); dataReturned += ", \n"; dataReturned += "\"deviceName\":"; dataReturned += String("\""); dataReturned += String(deviceName); dataReturned += String("\""); dataReturned += ", \n"; dataReturned += "\"epoch\":" + String(currentEpoch); dataReturned += ", \n"; dataReturned += "\"mode\":" + String(mode); dataReturned += " \n"; dataReturned += "}"; Serial.println(" OK - Data is below"); Serial.println(""); Serial.println(dataReturned); Serial.println(""); Serial.println(" Success - String is Ready"); colourLED(50); return dataReturned;}processData() gets the mean of the data collected from the sensors that tended to fluctuate and then dumps all the data to the Serial Monitor.makeLine() compiles all the data into the JSON string that is sent to Soracom. All values are parsed into a JSON buffer ready to be sent to the backend.Send Datavoid parseData(String dataToSend){ Serial.println(" OK - Setting Up Connection"); if(client.connect(url, 80)) { Serial.println(" OK - Connection Established, Parsing Data"); client.println("POST / HTTP/1.1"); client.println("Host: harvest.soracom.io"); client.println("User-Agent: Arduino/1.0"); client.println("Connection: close"); client.print("Content-Length: "); client.println(dataToSend.length()); client.println(""); client.println(dataToSend); Serial.println(" OK - Data Parsed"); } Serial.println(" OK - Getting Responce"); Serial.println(""); while(1) { if(client.available()) { char c = client.read(); Serial.print(c); } if(!client.connected()) { break; } } Serial.println(" Success - Data is Parsed");}Finally, the data is sent to Soracom. The device established a connection with the server and then prepares the credentials. The data is then sent to the server and the response is printed to the Serial Monitor.
The device then goes to sleep until a trigger wakes it up repeating the steps again.
Step 4: Setting Up the VariablesThere are certain variables that have to be edited before the project can be used. These are listed below. Instructions on setting them up are also below.
mode the mode of the device dictates if it takes samples periodically or if it takes samples at the action of a button. If this variable is set to 1, the device will need to be actioned through a button. If the mode is set to 2, the device will periodically take samples.deviceID and deviceName these are custom variables that are used to identify the device if a fleet of devices are being used. Each device used should be given a unique ID and Name so that they can be easily identified.sleepTime stores the amount of time that the device sleeps for between reads, it is set to 5 seconds in the code which is appropriate for testing but has to be changed when using it on the field. A sample could be taken at intervals of 15 minutes.proDebug is used when debugging, it is set to false in the code but if the serial monitor is needed when debugging it should be set to true. Note that the device will still print to the serial even if the debug is off. If the debug is on, the device will not run unless the serial monitor is on.Step 5: Uploading the CodeBefore setting up the backend, data has to be sent to it.
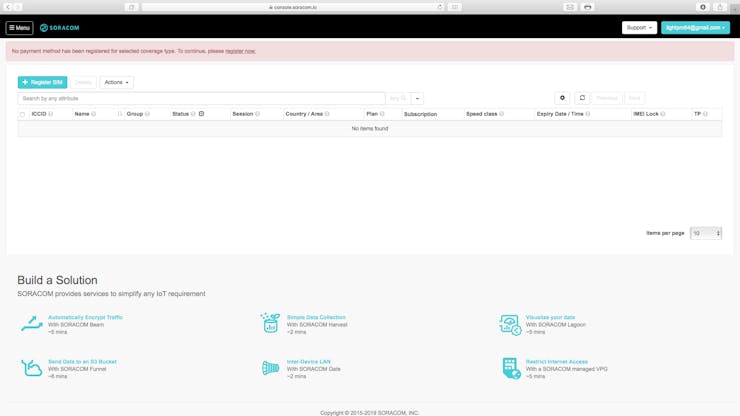
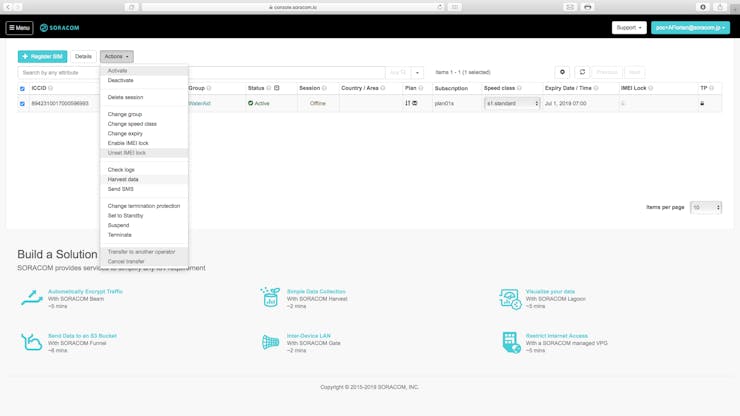
If you do not have a Soracom account and the SIM you are using is not registered, you will have to complete step 6 first.To do this, connect your MKR GSM to your computer and upload the code to the device, ensure that the mode of the device is set to 1 for this setup. After the code has uploaded, place all the sensors in water.
Now press the button on the device and wait for the data to collect and send. Repeat this a couple of times to populate Soracom Air.
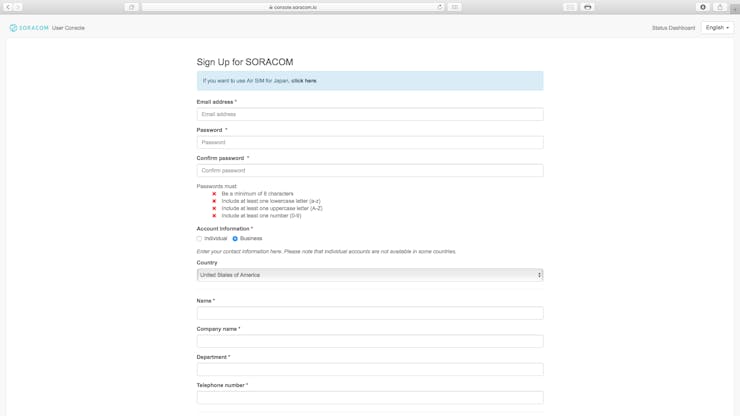
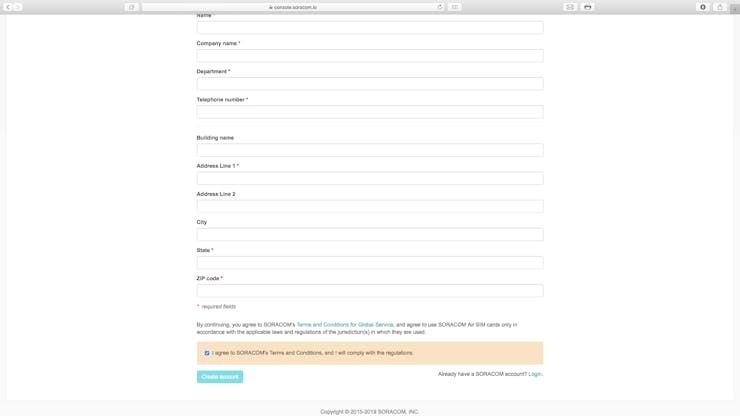
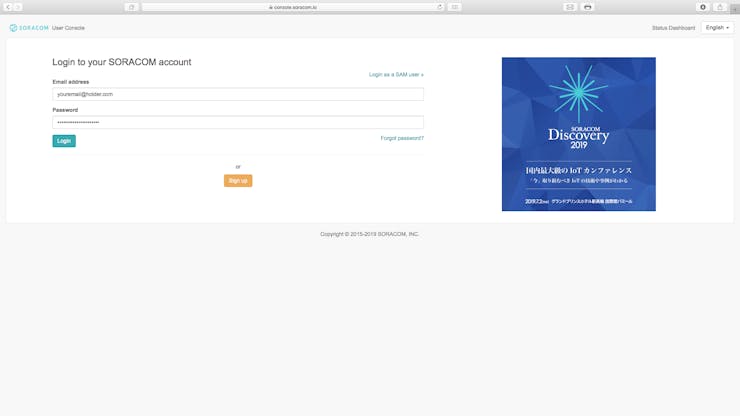
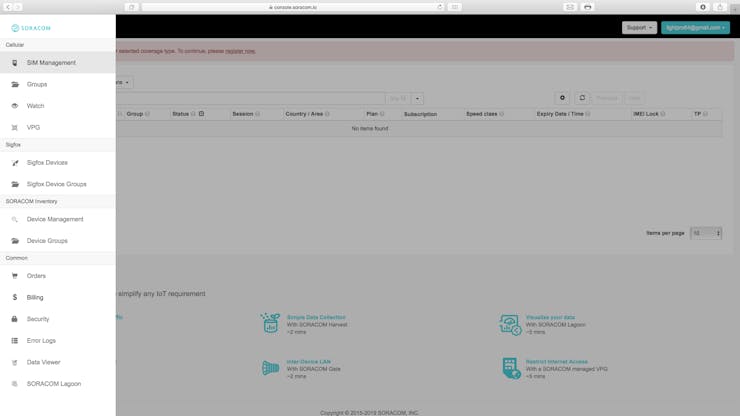
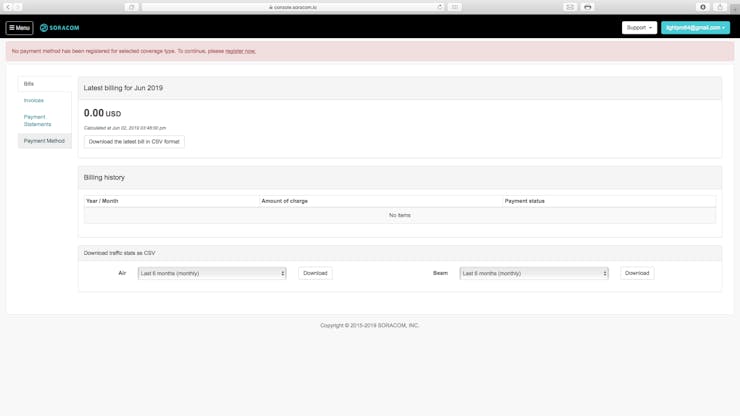
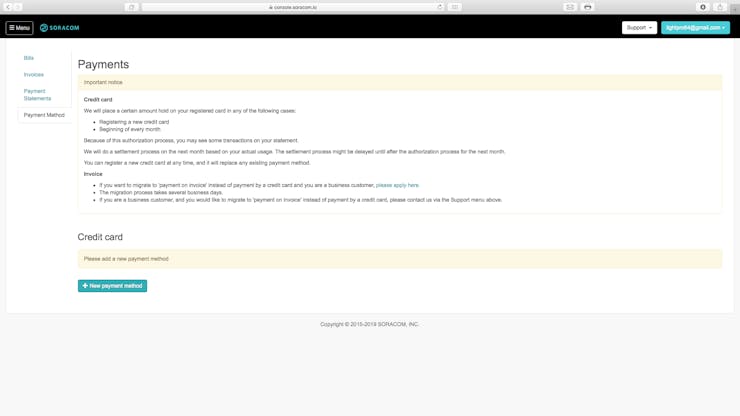
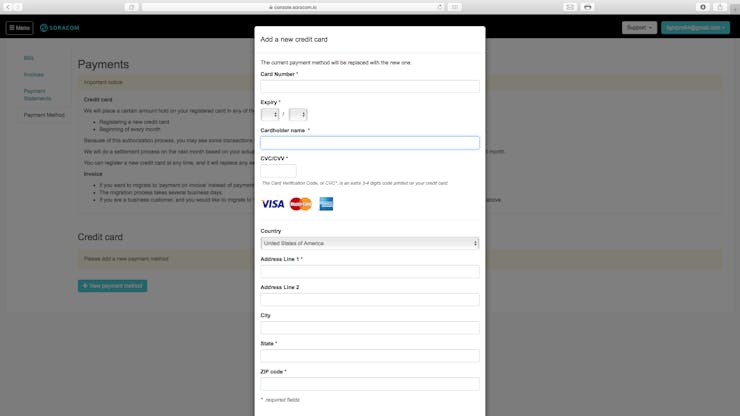
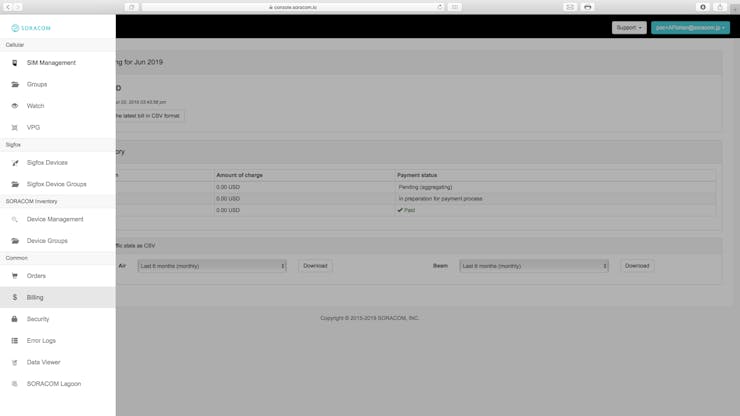
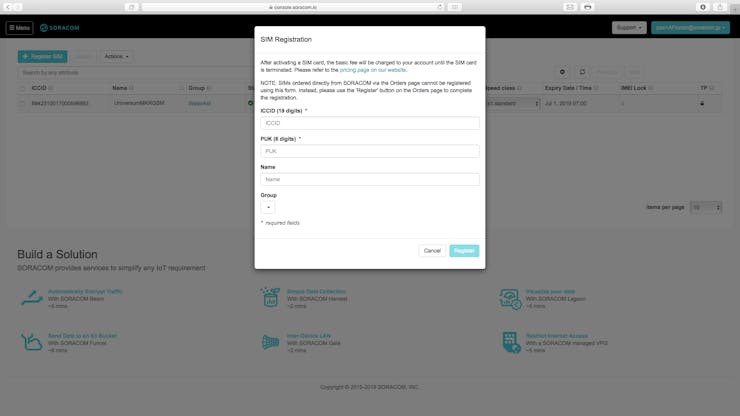
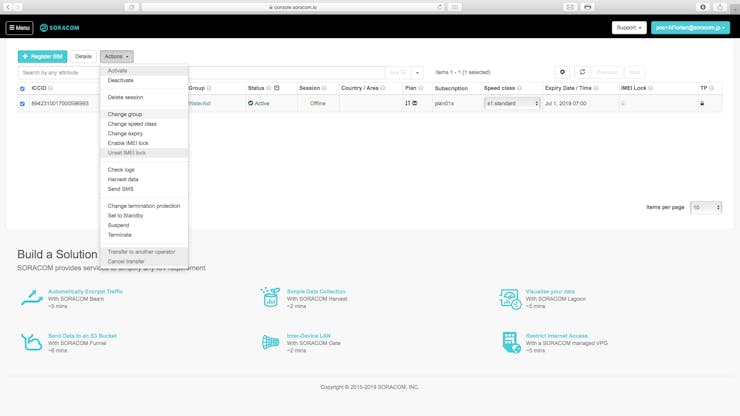
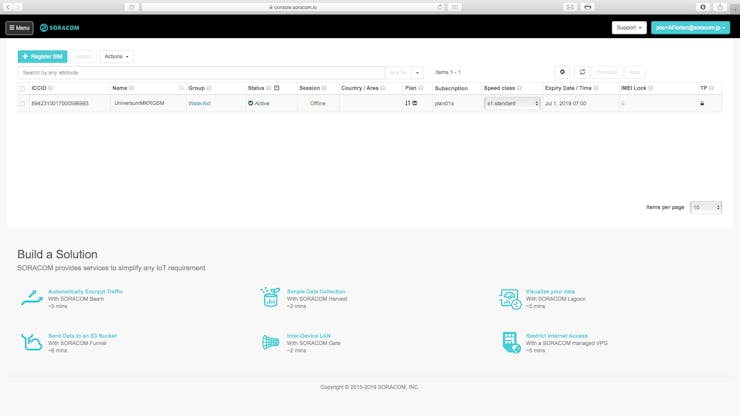
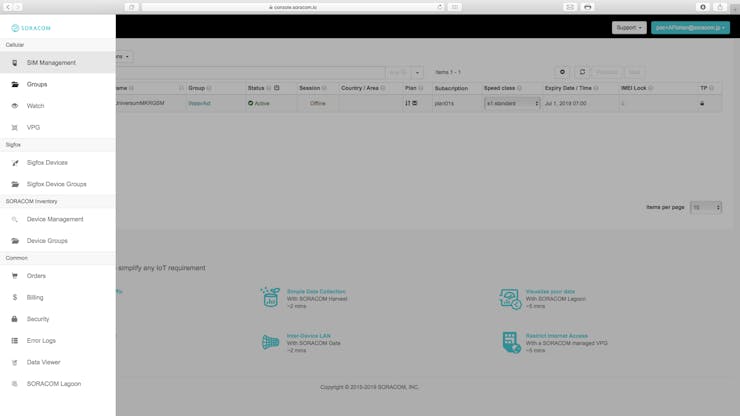
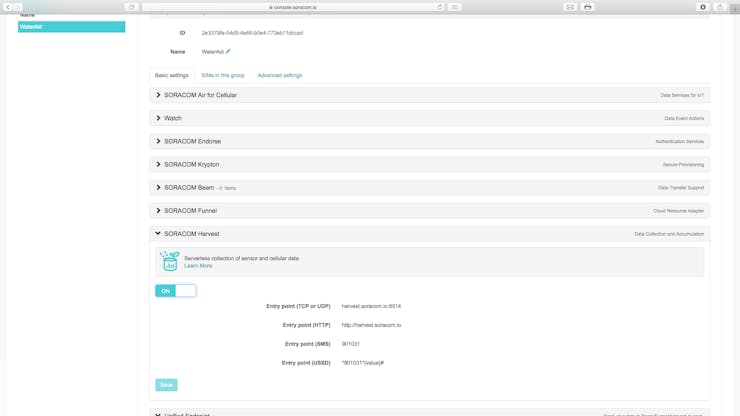
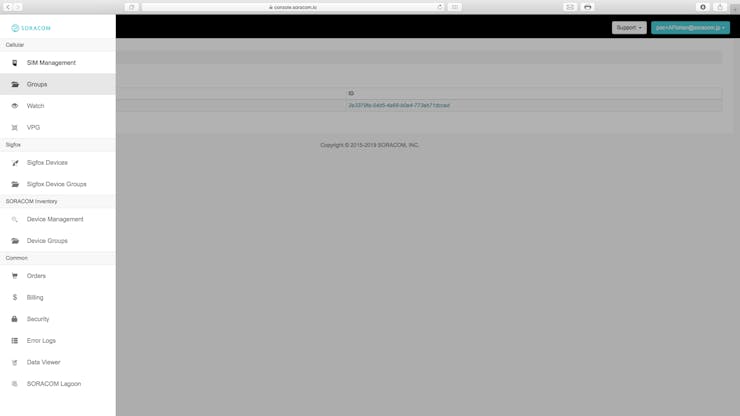
Step 6: Setting Up SoracomThis step is split into 2 sections, the first will cover creating an account with Soracom and registering your SIM while the other will cover setting up Soracom Harvest to collect the data from Air. If you already have an account with Soracom, skip the first section.
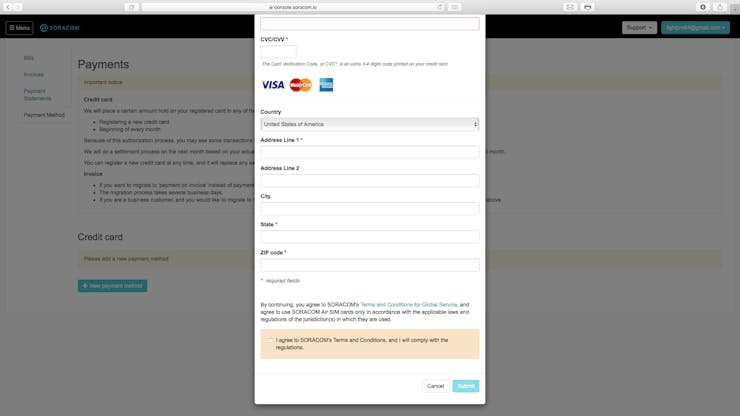
Section 1: Creating an Account


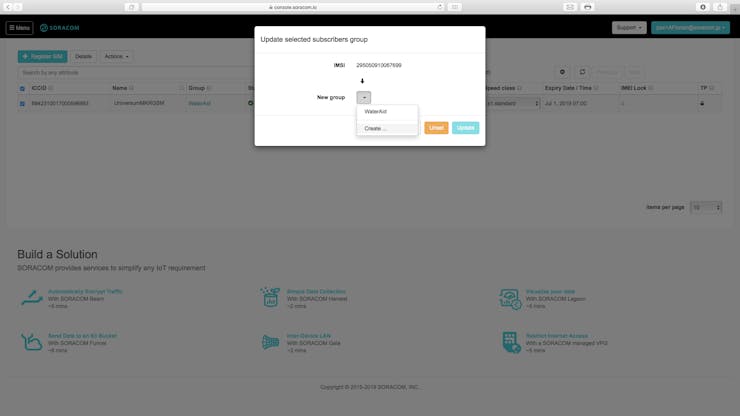
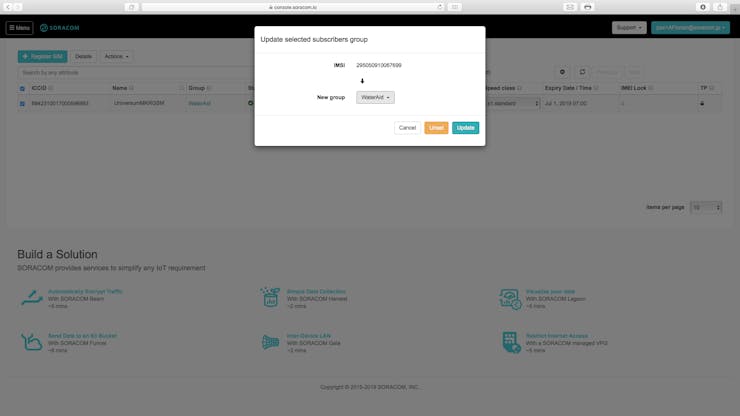
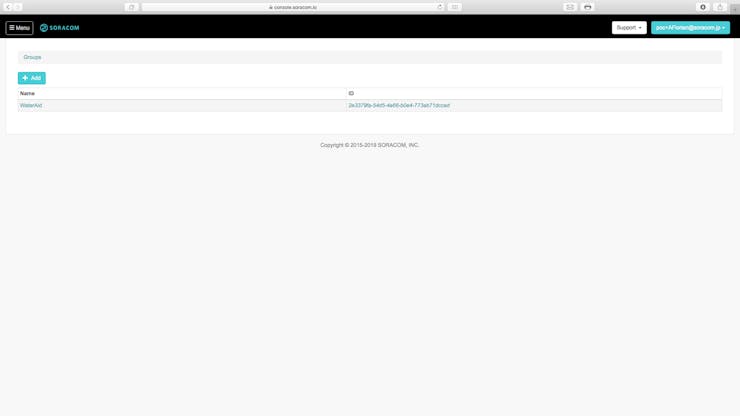
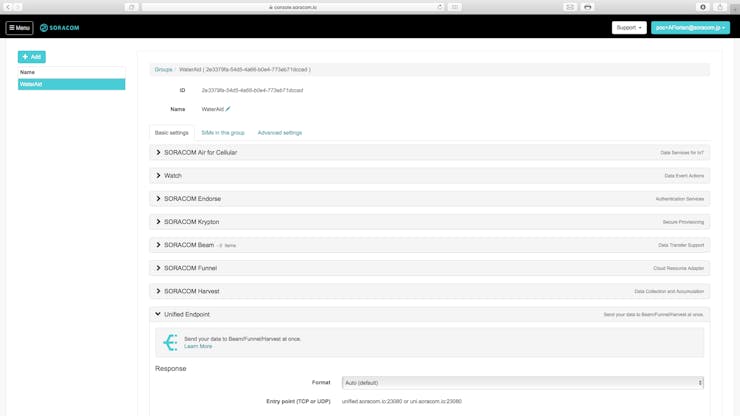
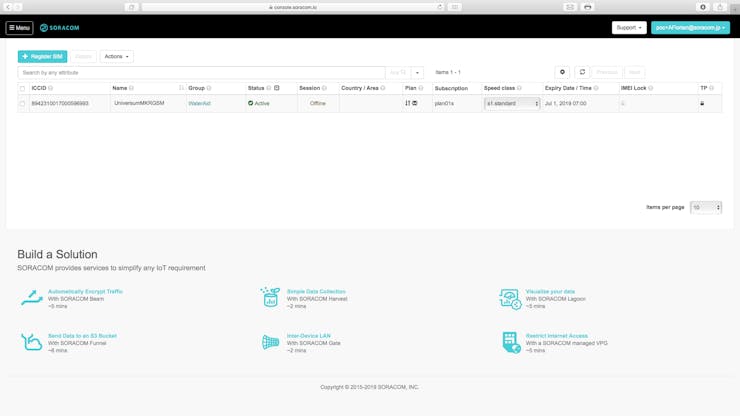 Section 2: Groupsand Harvest


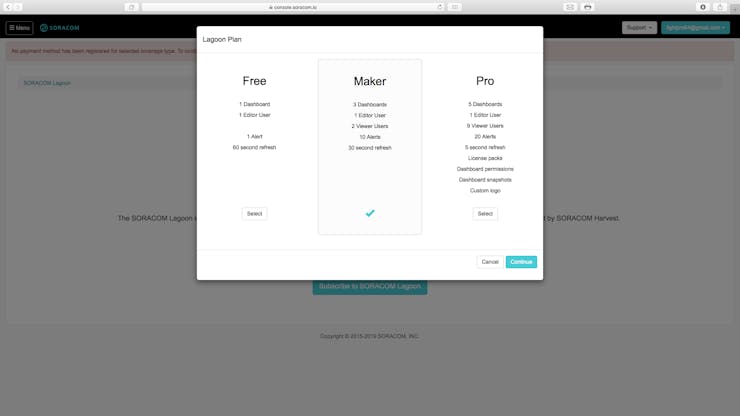
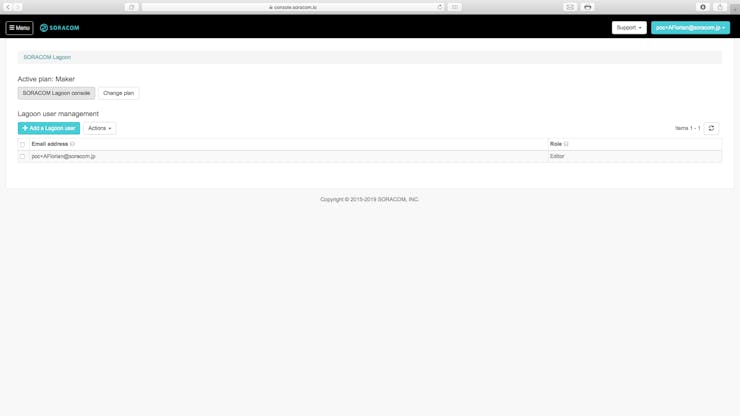
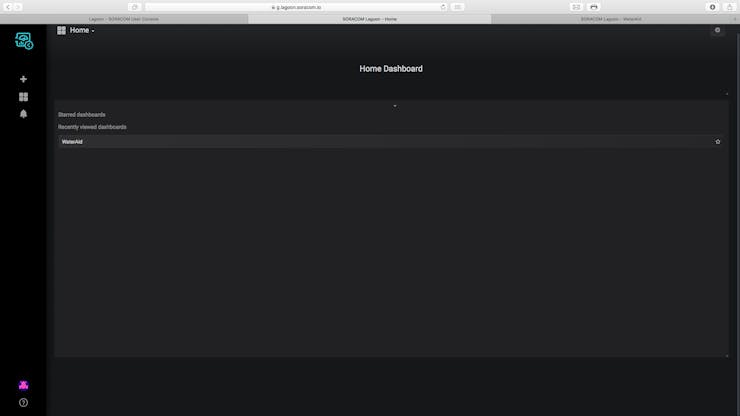
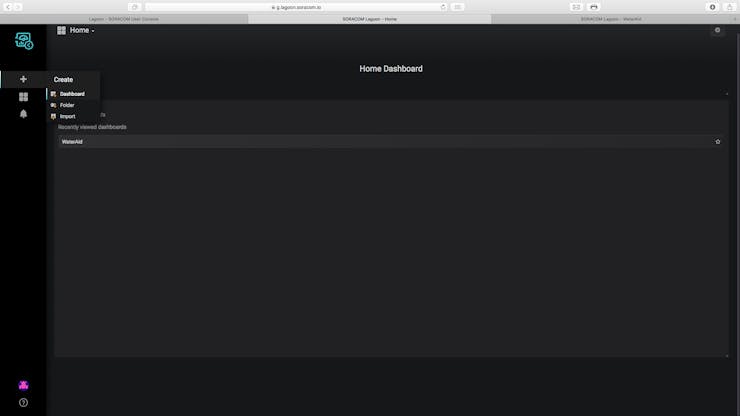
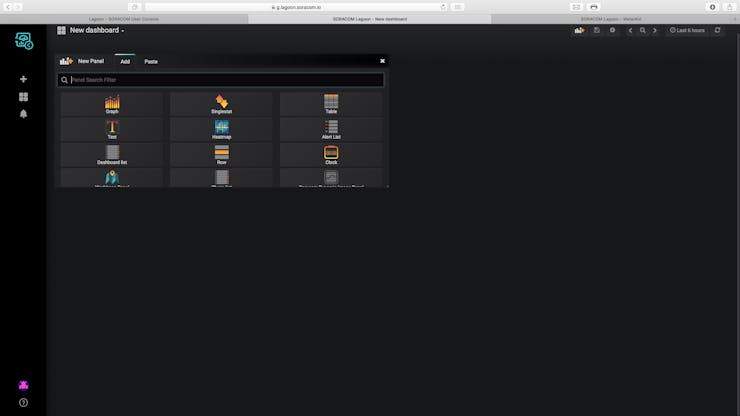
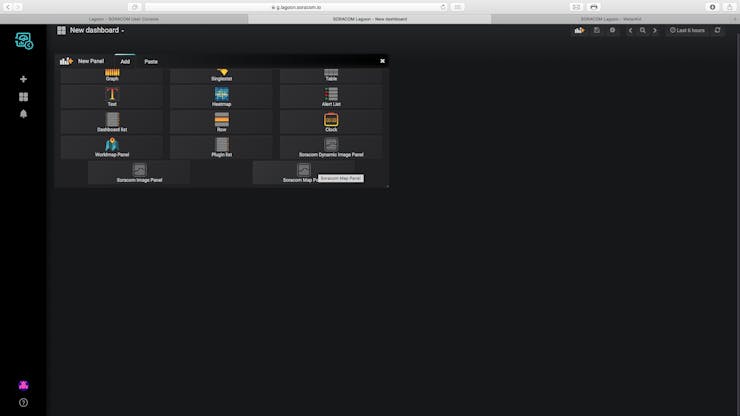
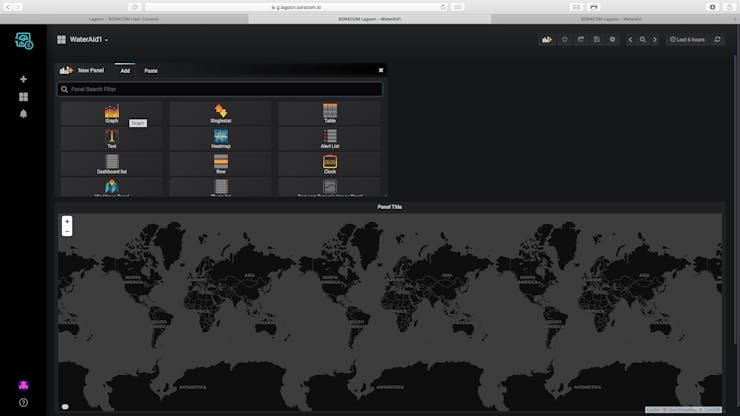
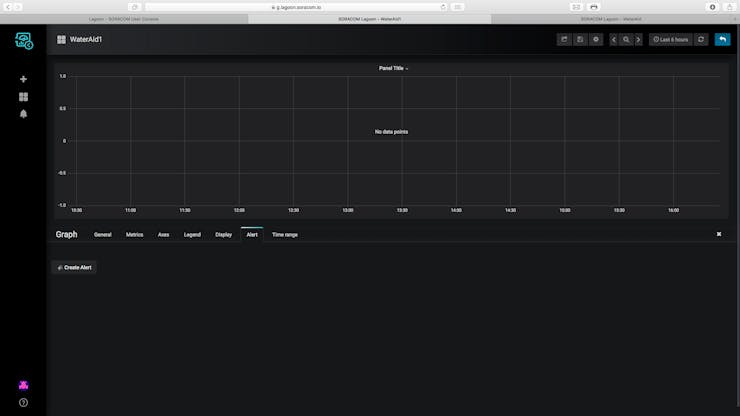
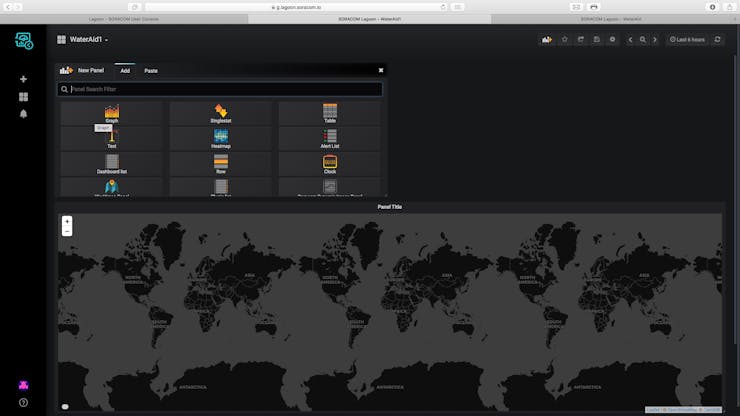
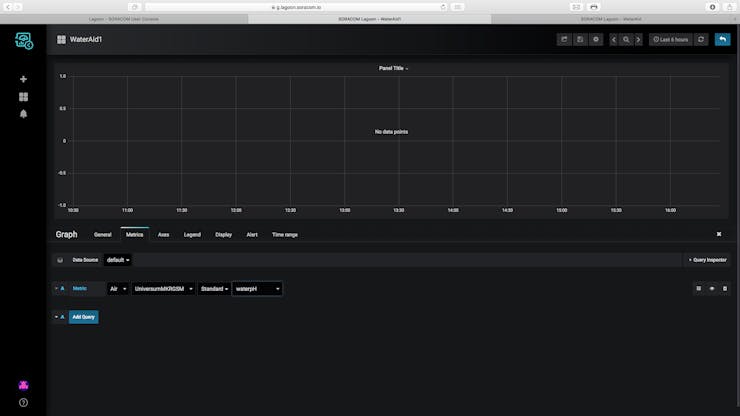
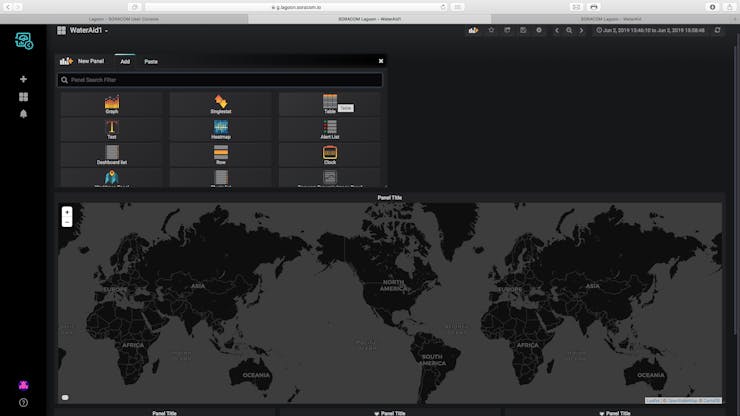
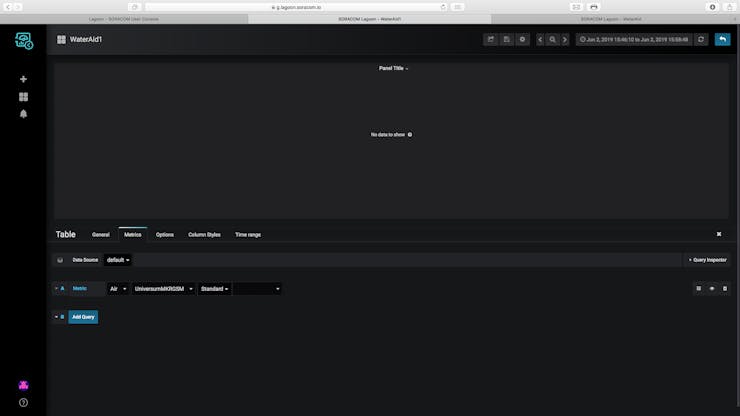
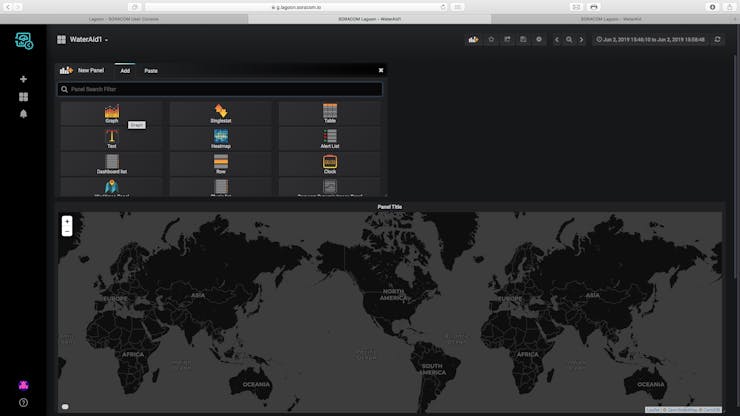
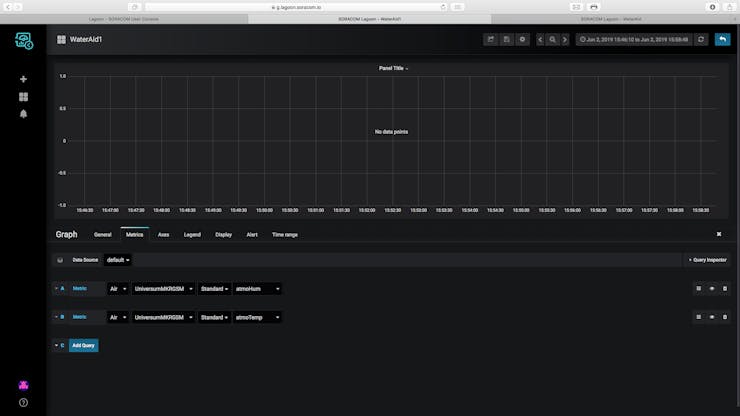
 Step 7: Setting Up Lagoon
The last thing to set up on Soracom is Lagoon, this is the tool that we will use to visualise our data and create email alerts if the data is not good. Follow the steps below.


 Calibration Problems
The turbidity and pH sensors have to be calibrated to be used precisely, you might find that when running the code, the turbidity might by 105% or the pH of water 3. In this case, the sensors have to be calibrated. A quick guide into calibrating them is below.
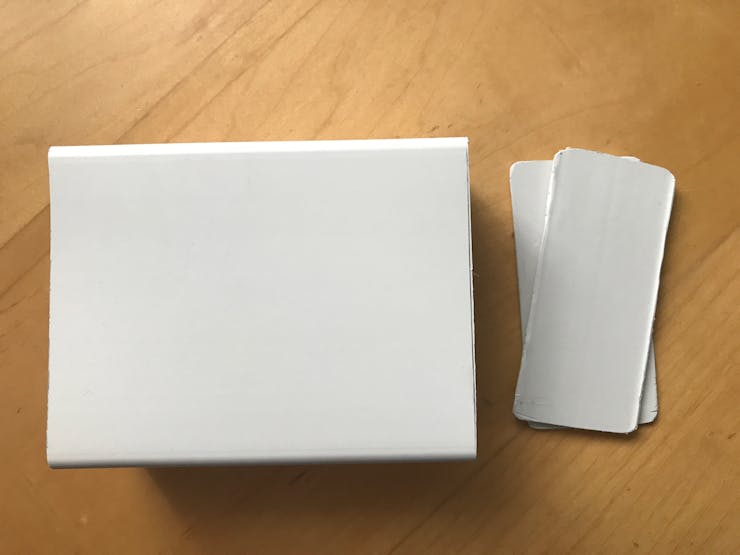
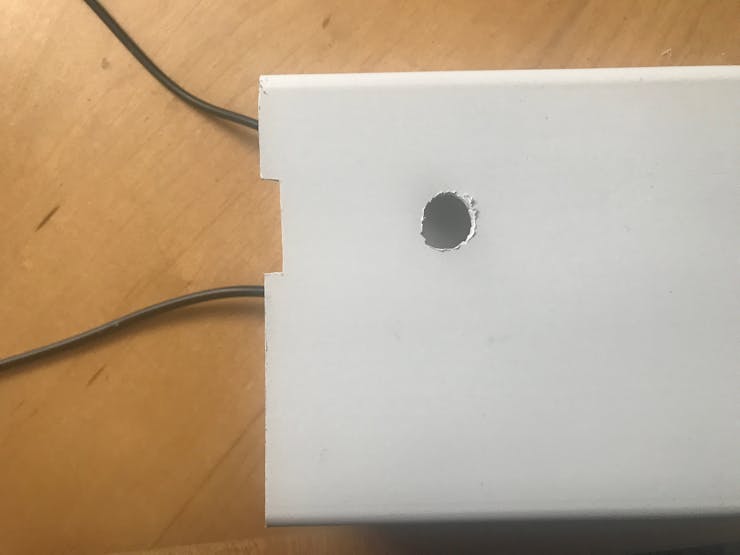
pH Sensor The pH sensor can be calibrated using the potentiometers on the module, place the probe in still bottled water of pH 7 and wait for 5 minutes, now develop a code that prints the pH from the sensor to the serial monitor. Twist the potentiometer until the pH is 7.Turbidity Sensor The turbidity sensor is not very precise and so a relative percentage, compared to pure water is taken. To refine the value of pure water, if your readings exceed 100% turbidity, you will need to place the turbidity sensor in pure water and develop a code that prints the voltage on the analog pin of the pH sensor to the serial monitor. A variable namedcalibration is found in sensors.h, change the value of that variable to the voltage received when the probe was placed in pure water.LibrariesFinally, I got an enclosure done for the project that could be easily portable but be fixed to collect samples both in mode 1 and 2. Steps are below.


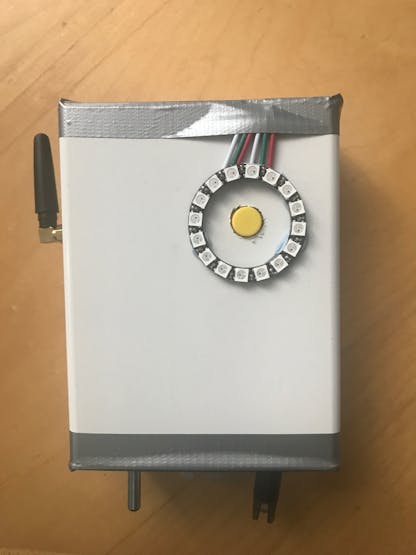
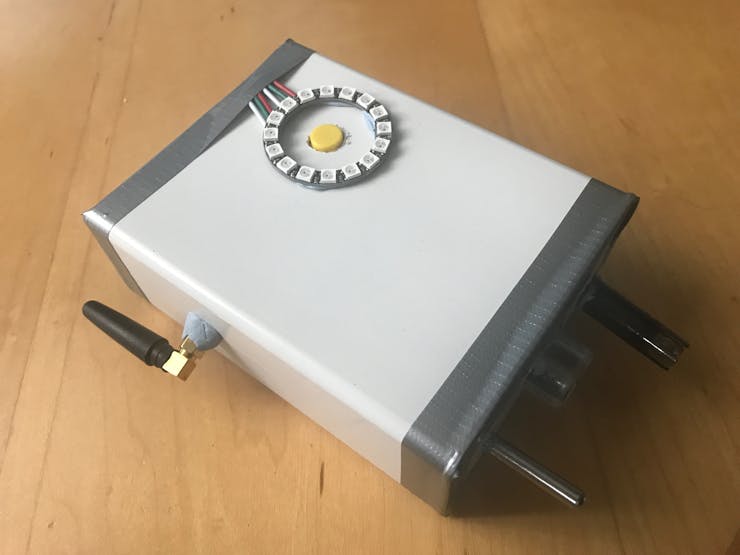
Finally, ensure that the mode is set accordingly and start using the device on the field. Check out your local river or lake and see how clean it is. Play around with the dashboard and see what other widgets it has.
Background
Today, data is the new currency and collecting it easily and efficiently is key to a better environment. By measuring the pollution of rivers and lakes collectively, we can raise awareness that the waters are getting dirtier and something has to be done.
I was thinking of an idea for the Soracom contest and I felt like I had to make something beneficial for the environment, the idea of people and companies working together on collective dashboards to visualise the status of rivers and lakes globally inspired me to take this project on.
What will you do to stop water pollution? Because action has to be taken today, and tomorrow is a day too late.