IoT Analytics & Data Visualization
IoT Dashboards and Notifications
Instant, serverless IoT dashboards
Use data collected in SORACOM Harvest to create dashboards combining multiple graphs, tables, maps and more with just a few clicks. No need to set up databases, servers, or other infrastructure
For complete technical details, use cases, and instructions for getting started, visit the Soracom developer site.
What does Lagoon solve?

Instant IoT dashboards
Create complete dashboards with just a few clicks

Easy dashboard sharing
Share read-only dashboards with anyone for easy collaboration

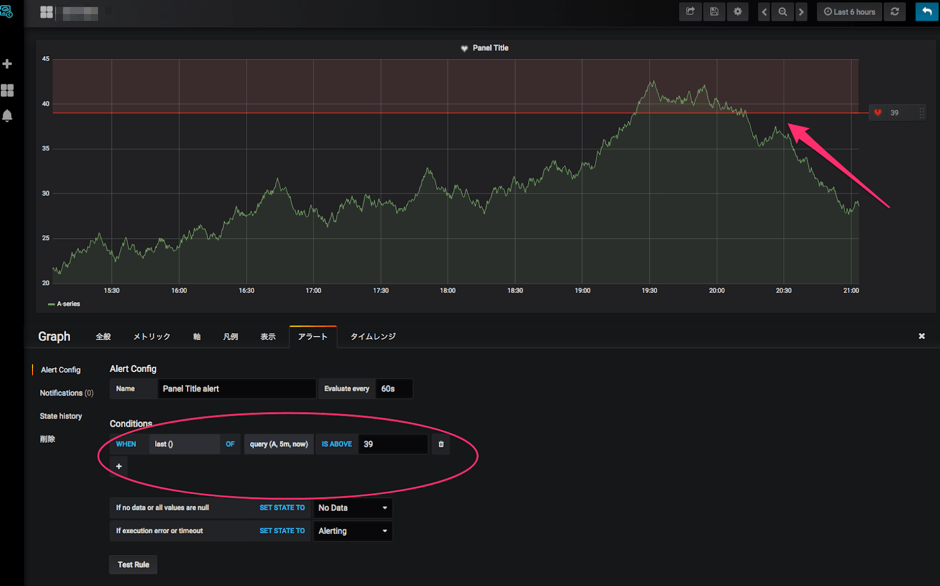
Real-time alerts
Set thresholds for any parameter tracked in Lagoon for automatic alerts by email, Slack,Webhook etc.
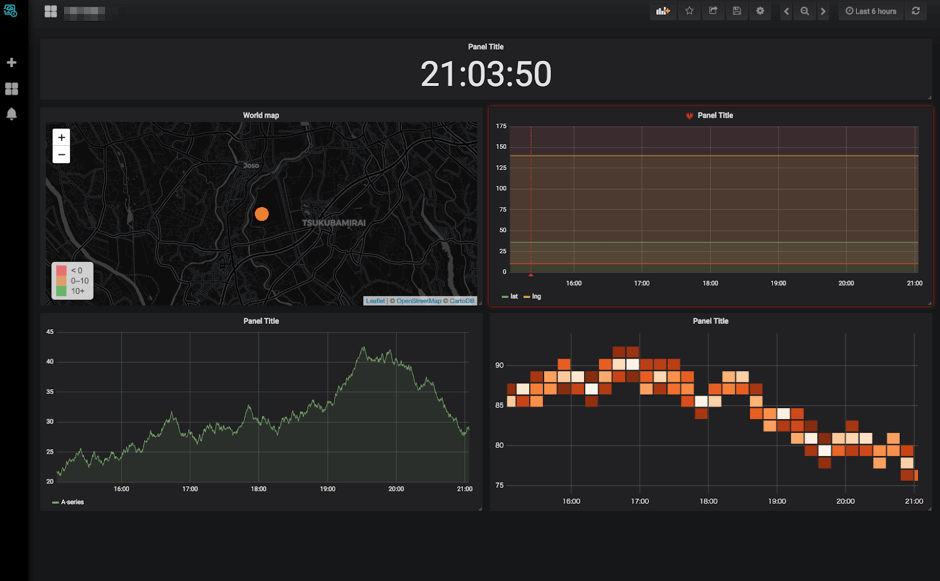
Instant data visualization
Use data collected in SORACOM Harvest to create elegant dashboards featuring graphs, tables, geomaps, lists, heat maps and more. Just a few clicks and you’re live.
Lagoon is based on Grafana, the open-source, community-backed resource for beautiful analytics and monitoring.
Cross-Network SIM Authentication
Set a threshold for any parameter in your dashboard (e.g. temperature > 120F; soil moisture content < 25%) and receive real-time text or image alerts by email, Slack, Webhook or other preferred channel