River Monitoring with an IoT Flow Meter
Things used in this project
Hardware components

|
Raspberry Pi 3 Model B+ | × 1 |

|
SORACOM Air Global IoT SIM | × 1 |

|
Male/Female Jumper Wires | × 3 |
| Huawei 3G USB dongle (MS2131i) | × 1 | |
| Liquid Flow Meter | × 1 | |
| USB 2.0 A Male to A Female Extension Cable | × 1 | |
| External Battery Pack (9000 mAh) | × 1 | |
| 4-40 x 1/2" screw | × 4 | |
| 1/4" x 1/2" hex bolt w/ hex nut | × 4 | |
| 1/4" - 1/8" Heat Shrink Tubing (8ft) | × 1 | |
| 1/8" - 1/16" Heat Shrink Tubing | × 6 | |
| Nylon Zip Ties | × 3 | |
| Waterproof Silicone Caulk | × 1 | |
| 1" PVC Pipe (5 ft) | × 2 | |
| 1" PVC Tee Fitting | × 3 | |
| 1" 2 Hole Rigid Conduit Strap | × 2 |
Software apps and online services

|
Raspbian | × 1 |

|
SORACOM Funnel | × 1 |

|
SORACOM Harvest | × 1 |

|
SORACOM Inventory - Remote management for connected devices | × 1 |

|
AWS IoT | × 1 |
Hand tools and fabrication machines

|
Soldering iron (generic) | × 1 |

|
3D Printer (generic) | × 1 |
| Heat Gun (generic) | × 1 | |
| Screwdriver (generic) | × 1 | |
| Hand Saw (generic) | × 1 |
Story
Overview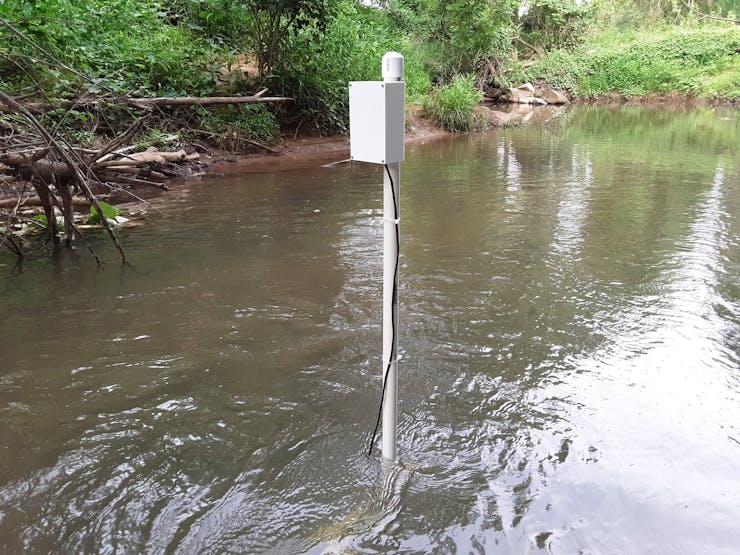
This project demonstrates how to build an internet connected flow meter that continuously measures a river's flow rate and makes real-time data available to users online.
The system can be deployed to remote rivers with a one-time setup, and can be left to run on its own, automatically collecting data without the need for users to be present. Multiple meters can be placed throughout a river to collect many points of data.
Measurement data is pushed to the cloud through the system's cellular network connectivity, enabled by a Soracom Global SIM card, and can be viewed online through Soracom Harvest. AWS IoT and CloudWatch services are used to send email notifications to users when the river's flow rate reaches a critical level.
Background
The flow rate of a river measures the volume of water that passes through a specific point over time. This rate rises and falls as water from rainfall flows in and out of the river system.
Measuring a river's flow rate can yield valuable information for a variety purposes:
Currently, measuring the flow rate of remote river areas is a very hands-on process. Surveyors need to hike out to the river of interest carrying their measuring equipment, set it up, take a measurement, disassemble it, and hike back.
Because of the effort required to collect a measurement, it is only done periodically for certain rivers. Without continuous monitoring many of the insights that flow rate provides are lost.
This project aims to solve this problem by making flow rate data easier to collect and more readily available to users who need it.
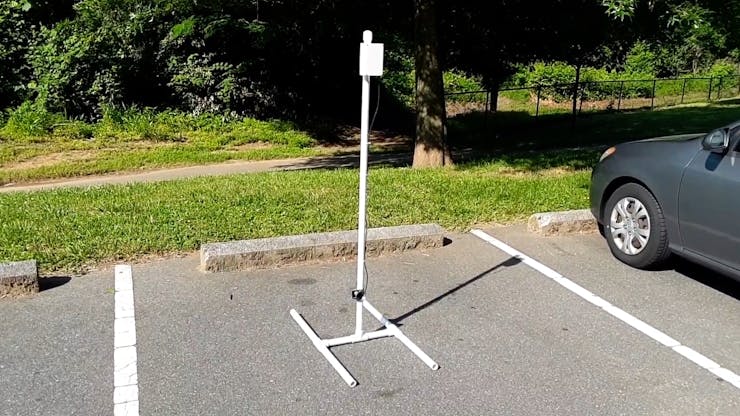
How it WorksThe IoT flow meter consists of a sensor and electronics, connected to a PVC pipe support structure, that can be deployed to a river to collect flow rate data.
A flow meter sensor is connected to the structure's vertical pipe at an adjustable height where it is held submerged underwater. The electronics are contained in an upper housing at the top of the structure outside of the water.
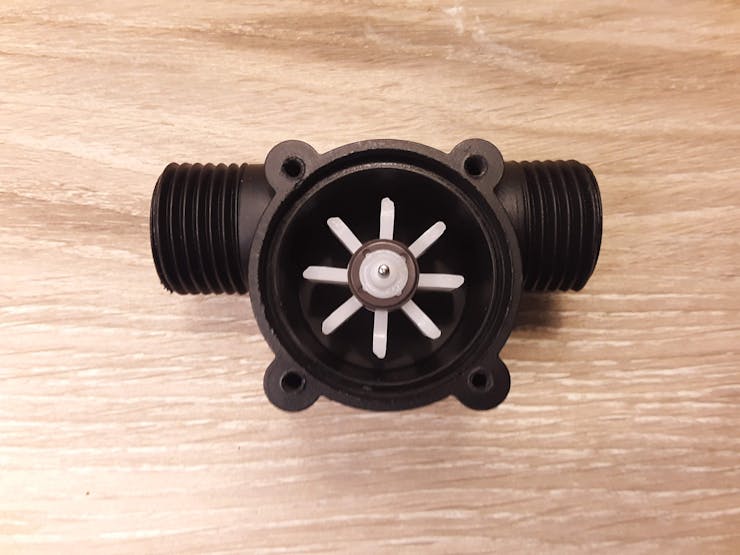
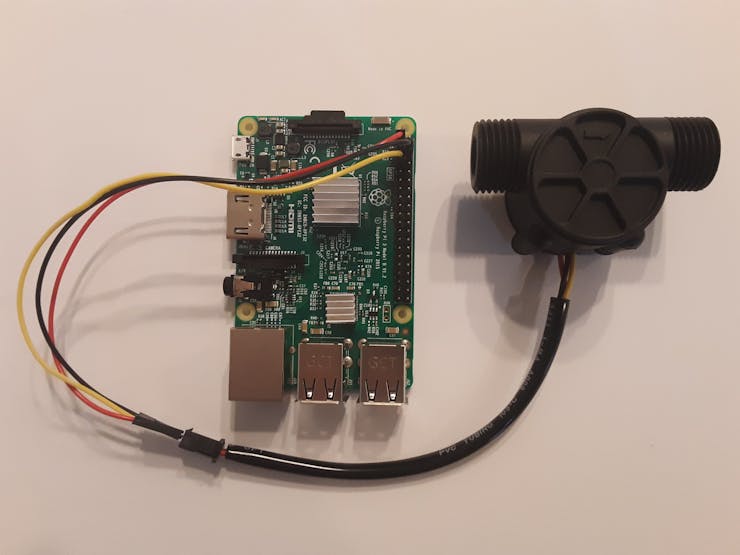
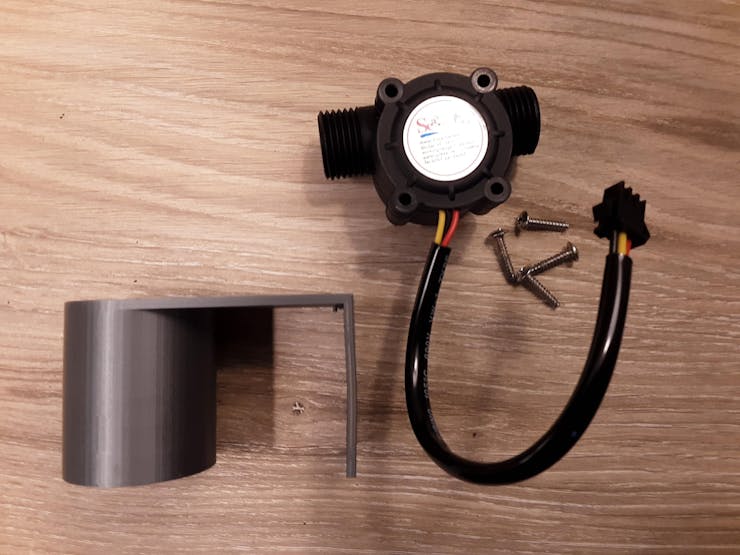
The system utilizes a YF-S201 liquid flow meter sensor, which contains a magnetic pinwheel that is spun by incoming water.
As more water enters the sensor the wheel spins faster, and this rate of spin (Hz) can be used to calculate how many liters of water flow through the sensor per minute (L/min), called the flow rate.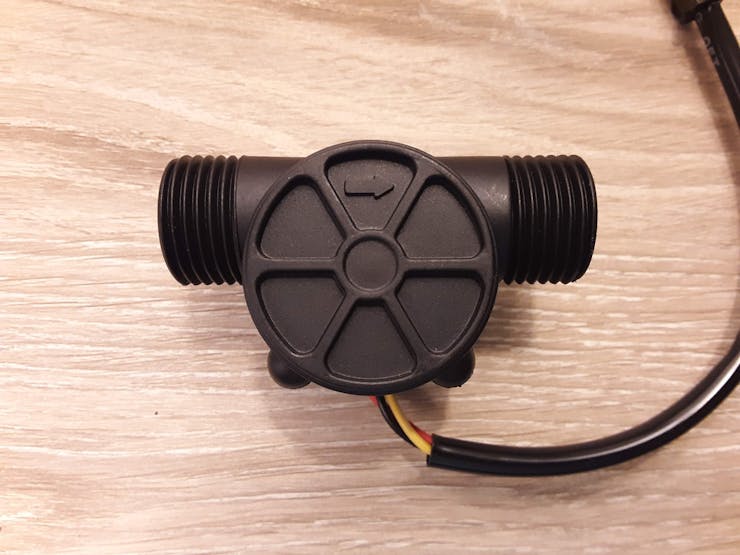
Note: This flow rate only tells the liters of water passing through the sensor itself, not the entire river. The sensor's flow rate is strongly correlated to the river's actual flow rate, but is not measuring it directly. The IoT flow meter provides only the sensor's flow rate and uses this as an approximation for the entire river.
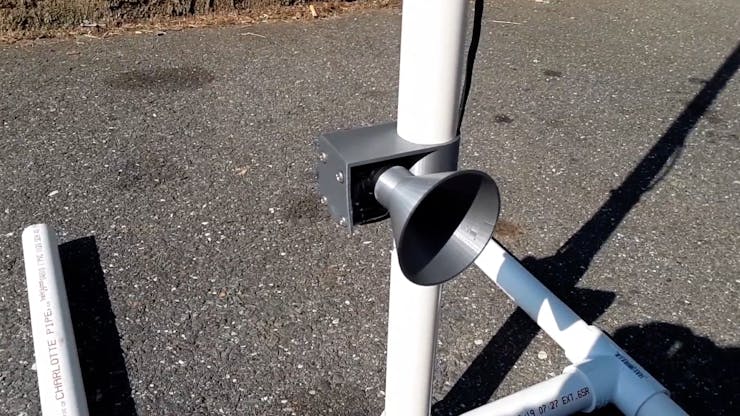
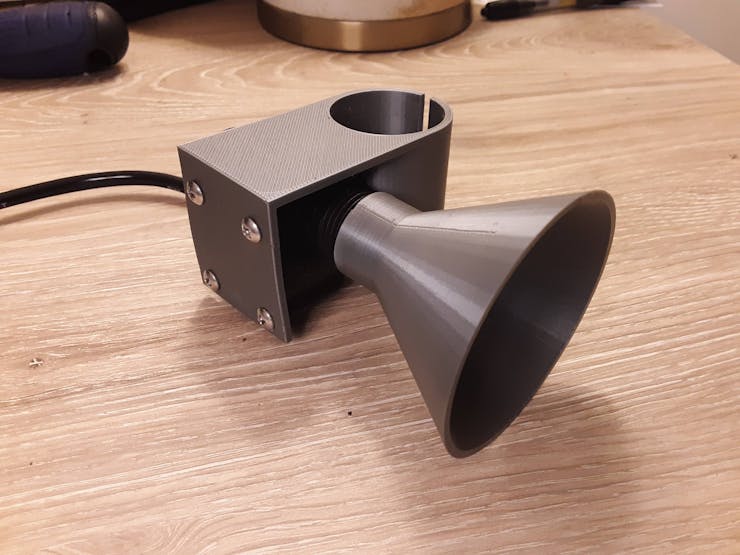
A 3D printed bracket is used to connect the sensor to the PVC pipe structure and a 3D printed funnel guides river water into the mouth of the sensor.
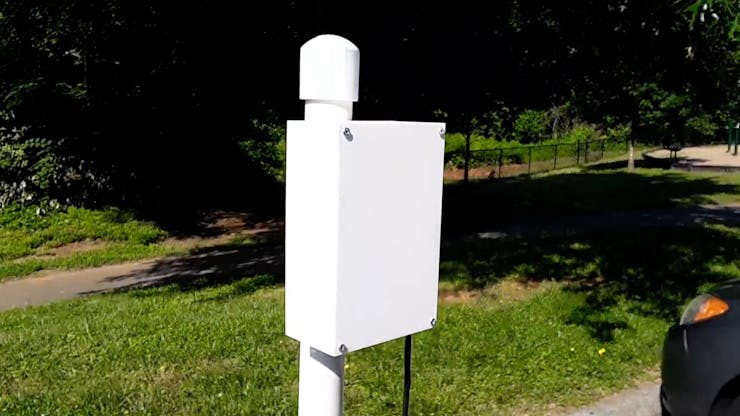
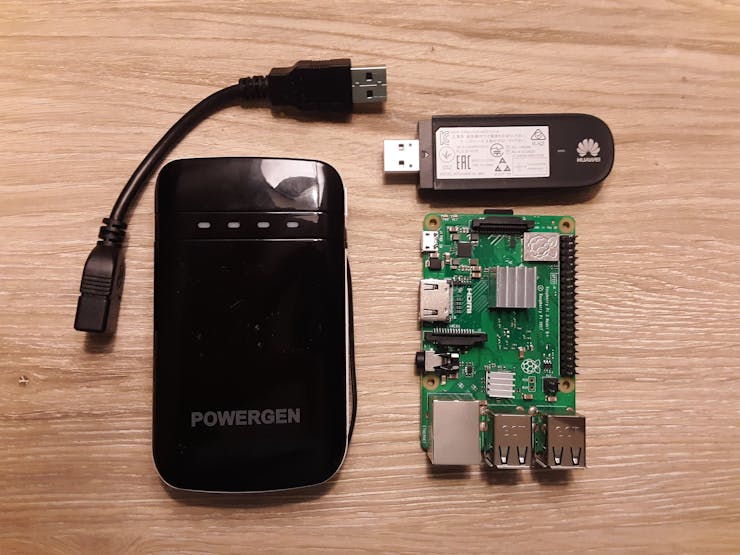
The electronics of the system include a Raspberry Pi, 3G USB modem with a Soracom Global SIM, and external battery, which are contained in a 3D printed housing. The sensor is connected to the Pi by water-sealed jumper wires that run the length of the vertical pipe into the housing.
The Pi runs a Python script where ever minute a flow rate measurement is collected from the sensor and, using the cellular connectivity provided by the modem and SIM card, pushed to the cloud.
The script makes an HTTP POST request to Soracom's Unified Endpoint which forwards the data along to two services: Soracom Harvest and Soracom Funnel.
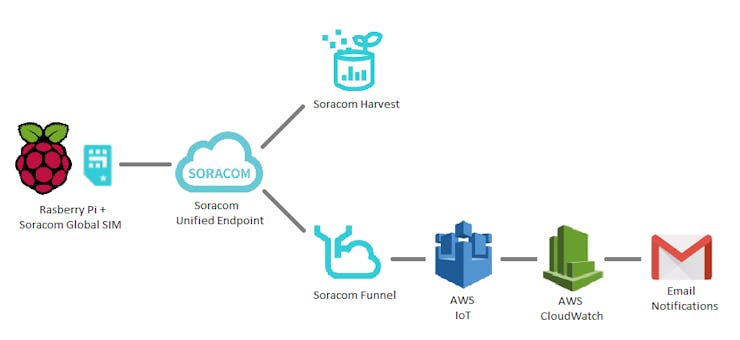
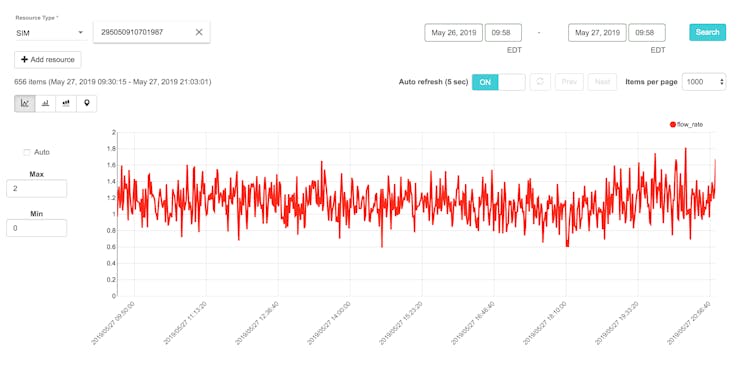
Soracom Harvest allows for easy real-time visualization of the incoming data. The console displays a live graph showing updated data values as they stream in. Users can monitor how the data changes over a selected window of time.

Soracom Funnel takes the data and forwards it further on it by sending it to an AWS IoT endpoint, where an AWS IoT rule is then used to push the data to AWS CloudWatch.
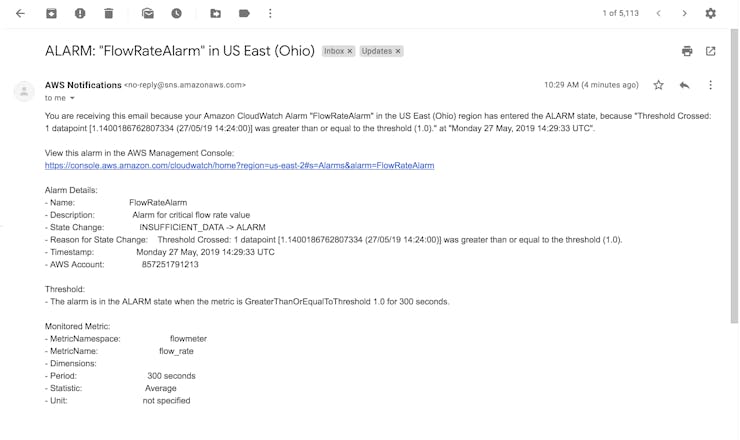
A CloudWatch alarm is configured to monitor when the flow rate surpasses a critical value and automatically sends out an email notification to any subscribed users letting them know that the alarm has been triggered. This feature allows users to stay aware of important changes in the river's flow rate without having to monitor it live.
Architecture and Operational ExcellenceThe IoT flow meter is meant to be a solution to a problem that traditionally requires more hands-on, expensive equipment to collect data. While this prototype has shown that it can be fielded and provide results, there are further things to consider in moving to a production version.
Cost: The total cost for the system is ~$120, with the largest expenses being the Raspberry Pi ($35) and the 3G Modem ($60). This price could likely brought down with bulk supplies. This total cost is reasonable when considering the man-hours saved by using this IoT device instead of paying surveyors/engineers to collect measurements manually. Scalability: The system could be scaled up to many more units depending on demand. Building a mass amount of units would become easier by transitioning to an pre-fabricated circuit that contained all necessary electronics, and developing a better pipe structure that was pre-assembled.If scaled up to 1000's of units running worldwide, Soracom and AWS IoT could still remain the backbone of how data is collected and distributed. Individual accounts and access may need to be set up for each user, and AWS IoT can accomplish this though IAM user groups, which grant permissions to view/edit data to only specific users.
Reliability: Consistent and accurate measurements that reflect the actual flow rate is important to this problem. More testing needs to be done to better understand the different effects that may influence the sensor's readings like depth and placement in the river.The system relies on having a reliable cellular network as well. Currently, if an attempted request to Soracom fails due to a network timeout, that data is lost. Further updates to the tool would include backing up measurements so they could be saved and pushed to the cloud when the connection is reestablished.
Security: The IoT flow meter is designed to be left unattended, which puts its physical security at risk. Currently, there is no way to determine what happens to the system if it goes offline or is missing, but a future version may include a GPS module that includes the system's current coordinates with each data push. This would help track the location of the system at any time. Build InstructionsBelow are instructions on how to prototype, build, and receive notifications from the IoT flow meter.
Begin this project by first building a prototype circuit to test the liquid flow meter's functionality, enabling internet connectivity, and pushing measurements to the cloud. Next build the pipe structure and attach the components so its ready to be deployed. Finally, setup AWS CloudWatch and subscribe to email alerts when a critical flow rate occurs.
These instructions assume you have access to the Rasberry Pi's terminal, either through SSH or a keyboard/mouse/monitor setup. The Pi must also have an internet connection either through WiFi or ethernet for the initial setup.
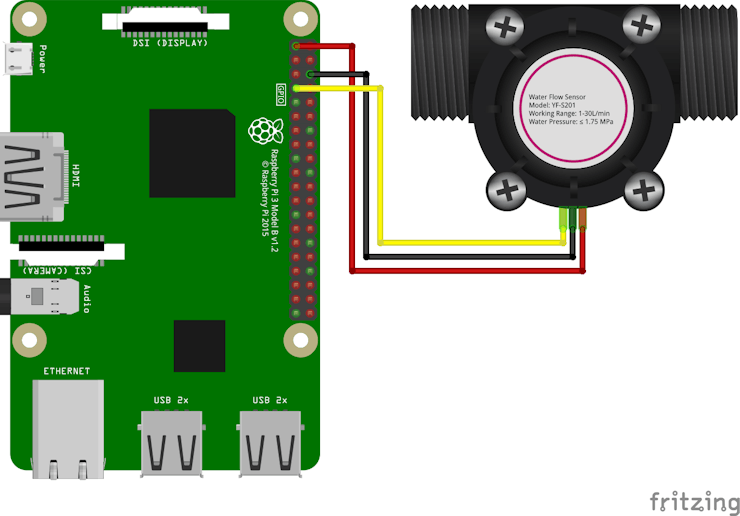
Prototype CircuitStep 1: Setup the Test CircuitUsing the male-to-female jumper wires, make the following connections from the YF-S201 liquid flow meter's wires to the Raspberry Pi GPIO Pins:
 Step 2: Test Sensor MeasurementsA Python script can be ran to take readings from the sensor that is now connected. Open the Raspberry Pi terminal and enter the following commands to create and navigate to a
 flowmeter directory on the Pi's desktop where the script will be stored: $ cd /home/pi/Desktop
$ mkdir flowmeter
$ cd flowmeter
Using Python's IDLE, or another text editor, copy the following Python code and save it as flowmeter.py in the folder that was just created: import json
import time
from datetime import datetime
import RPi.GPIO as GPIO
class FlowMeter():
''' Class representing the flow meter sensor which handles input pulses
and calculates current flow rate (L/min) measurement
'''
def __init__(self):
self.flow_rate = 0.0
self.last_time = datetime.now()
def pulseCallback(self, p):
''' Callback that is executed with each pulse
received from the sensor
'''
# Calculate the time difference since last pulse recieved
current_time = datetime.now()
diff = (current_time - self.last_time).total_seconds()
# Calculate current flow rate
hertz = 1. / diff
self.flow_rate = hertz / 7.5
# Reset time of last pulse
self.last_time = current_time
def getFlowRate(self):
''' Return the current flow rate measurement.
If a pulse has not been received in more than one second,
assume that flow has stopped and set flow rate to 0.0
'''
if (datetime.now() - self.last_time).total_seconds() > 1:
self.flow_rate = 0.0
return self.flow_rate
def main():
''' Main function for repeatedly collecting flow rate measurements
and sending them to the SORACOM API
'''
# Configure GPIO pins
INPUT_PIN = 7
GPIO.setmode(GPIO.BOARD)
GPIO.setup(INPUT_PIN, GPIO.IN, pull_up_down=GPIO.PUD_UP)
# Init FlowMeter instance and pulse callback
flow_meter = FlowMeter()
GPIO.add_event_detect(INPUT_PIN,
GPIO.RISING,
callback=flow_meter.pulseCallback,
bouncetime=20)
# Begin infinite loop
while True:
# Get current timestamp and flow meter reading
timestamp = str(datetime.now())
flow_rate = flow_meter.getFlowRate()
print('Timestamp: %s' % timestamp)
print('Flow rate: %f' % flow_rate)
# Delay
time.sleep(5)
if __name__ == '__main__':
main()
This script defines a FlowMeter() object class that is used to track pulses received from the sensor as its pinwheel spins and calculate the current flow rate. Each new pulse triggers the pulseCallback() method, where the rate of pulses per second (Hz) is divided by a constant to calculate the flow rate in liters per minute (L/min). This conversion is defined in the sensor's datasheet. The getFlowRate() method returns the current flow rate. The main() function is called when the script is launched and defines the GPIO pins used by the sensor, and initiates an instance of the FlowMeter() class.An infinite loop is entered where on each pass a flow rate measurement and its timestamp collected and printed out to the console. The time.sleep(5) statement, which controls the delay between loops, is set to 5 seconds. The loop will run continuously until canceled by the user.Before deploying the final IoT flow meter to a river, edit this script to adjust this sleep time to the frequency you want to collect river measurements. A value of 60 will take measurements at one minute intervals.
Launch the Python script with the following command:
$ python3 flowmeter.pyFlow rate measurements and timestamps are printed out to the console every 5 seconds:
Timestamp: 2019-05-20 22:00:41.267727 Flow rate: 0.000000 Timestamp: 2019-05-20 22:00:46.278729 Flow rate: 0.000000 Timestamp: 2019-05-20 22:00:51.283864 Flow rate: 0.000000The flow rate should be zero while the sensor's pinwheel is stopped. Try blowing into the sensor to spin the wheel and watch how the flow rate value changes.
PressCtrl+C to stop the script.Step 3: Enable Cellular ConnectivityWith the sensor working, the next step is to send its readings to the cloud. This is enabled by a 3G USB modem with a Soracom Global SIM card that is plugged into the Pi and Soracom's Harvest service.
Soracom's own IoT stater kit tutorial provides good instructions on getting setup with a Soracom account, configuring the USB modem, and enabling the Harvest service. Complete the following sections from their tutorial: Setup your Soracom AccountSetup the 3G USB ModemEnable Soracom HarvestStep 4: Send data to Soracom HarvestTheflowmeter.py script can now be updated with additional code to send measurements to Soracom Harvest. Begin by installing the requests Python package, which allows HTTP requests to be made from Python, with the following command: $ sudo apt-get install python-requests
Open flowmeter.py and add the following line to list of import statements: import requests
Add the following code inside the main() function above the time.sleep(5) statement:# Build payload
payload = {
'timestamp': timestamp,
'flow_rate': flow_rate
}
# Publish to Soracom API
headers = {'Content-Type': 'application/json'}
try:
print('Publishing to SORACOM API...')
r = requests.post('http://unified.soracom.io',
data=json.dumps(payload),
headers=headers,
timeout=5)
except:
print('Error: Connection timeout.')
This additional code wraps up the timestamp and flow rate values into a JSON string, and uses a POST request to send it to the Soracom Unified Endpoint.
A complete version offlowmeter.py is attached to this tutorial. Run the script again with the following command: $ python3 flowmeter.py
With the Harvest console open you should begin to see data streaming in. The flow rate data is plotted on a graph that gets updated each time a new value is received.
 Step 5: Run Script at Bootup
The Raspberry Pi will disconnected from a monitor, mouse, and keyboard and powered by an external battery in final setup of this project. Therefore, its necessary for the Python script to be launched automatically without user interaction.
Configure the Pi to run the script when it boots up by editing the/etc/rc.local file. Use the following command to edit this file: $ sudo nano /etc/rc.local
Add the following line above the last line in the file, exit 0: python3 /home/pi/Desktop/flowmeter/flowmeter.py &
Press Ctrl+X, Y, and Enter to save and close the file. The full path to flowmeter.py is required because the Pi won't be in the flowmeter directory when it boots up. Including the & at the end of the line ensures that script is run as its own process, and won't block other bootup processes while it runs. Disconnect the Pi from any monitor, keyboard, and mouse and plug the external battery pack into the Pi's micro USB port. It may take a few moments for the Pi to start up and the USB Modem to connect. Once connected, open the Soracom Harvest console to view incoming data.
The video below demonstrates a working prototype of the flow meter.
Assemble StructureStep 1: Build the Structure BaseThe PVC pipe structure holds the components in place, keeping the sensor underwater and the electronics above water.
Begin by using the handsaw to cut the PVC piping into four 15.5" inch pieces and two 7" inch pieces. Using the tee fittings, assemble them into the "H" base of the structure.
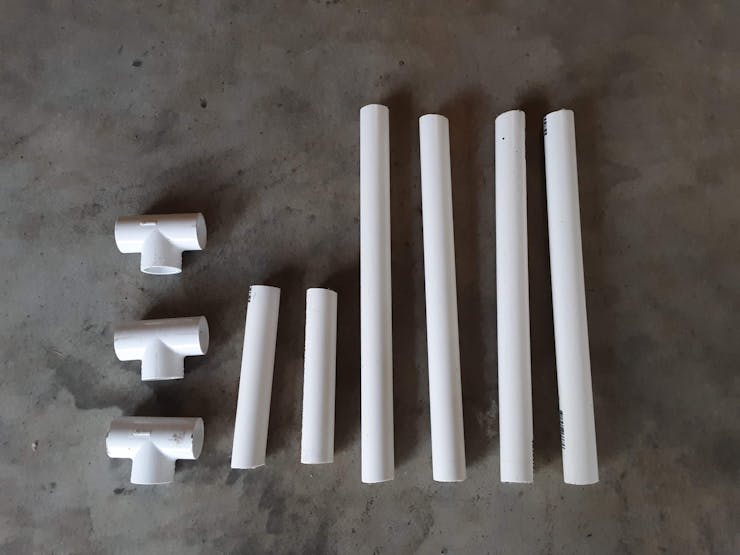
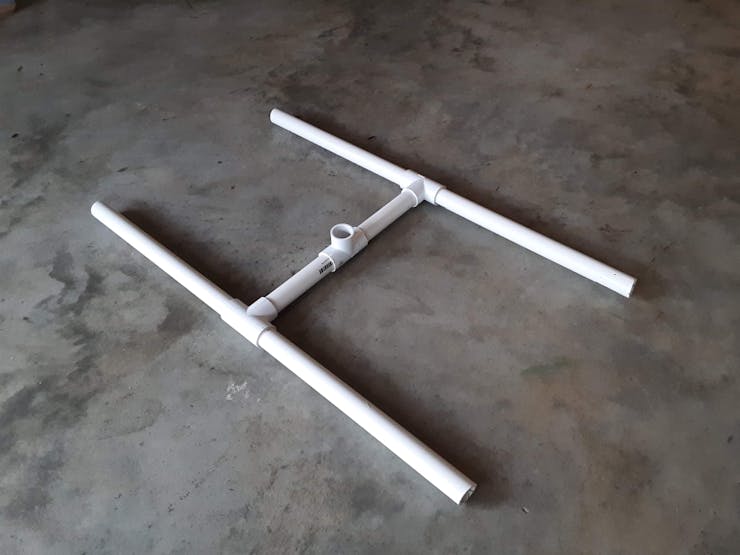
Use one 5' foot PVC pipe as the vertical bar that is inserted into the center of the "H" base.
Step 2: Waterproof sensorSince the flow rate sensor will be submerged underwater, it needs to be protected from any water damage. The length of its connection wires also needs to be extended to run up the vertical pipe into the electronics housing.
Start by cutting the end cap off the connection wires. Then, use three 4' foot lengths of jumper wire to extend the DC power (red), ground (black), and output (yellow) wires by soldering their ends together. Use the small heat shrink to individually wrap each solder connection.
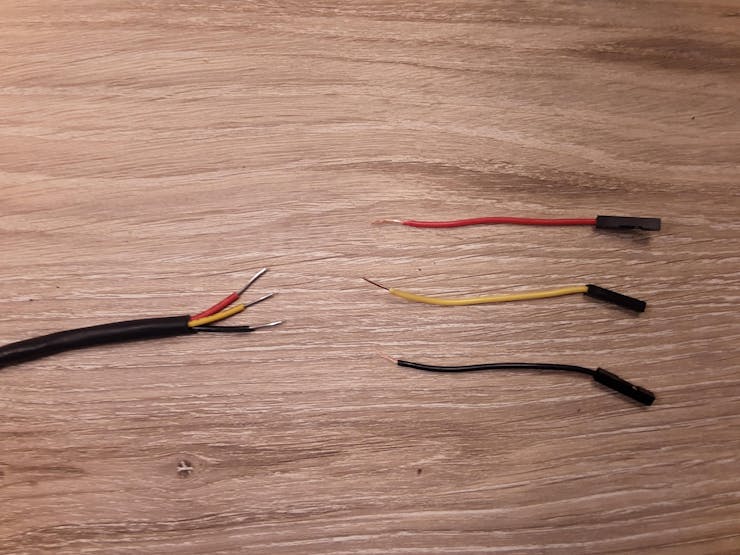
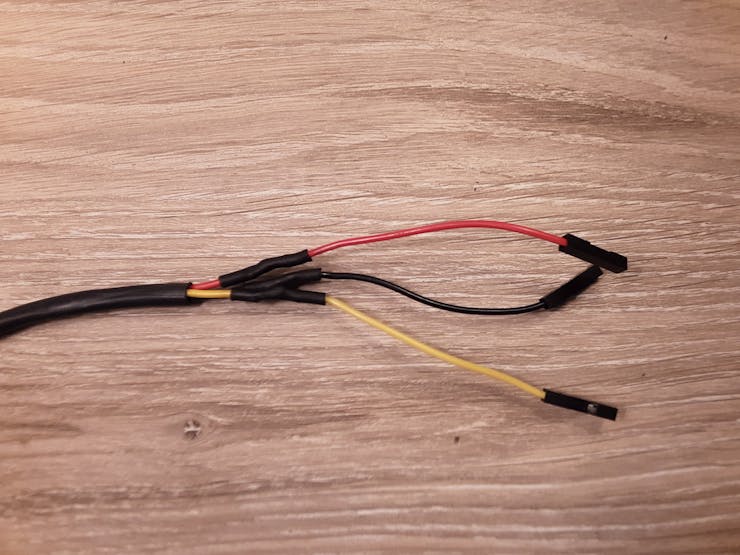
The ends of the full length wires should each be connect to a female jumper wire end cap so they can easily connect to the Raspberry Pi's GPIO pins. Cut 3 male-to-female jumper wires and solder the female jumper end caps to the three full length wires. Individually wrap each connection with heat shrink tubing.
Use a 4' foot length of heat shrink tubing to encase all three full length wires now coming out of the sensor. Make sure the tubing runs up to the base of the sensor help prevent water from getting inside the sensor housing.
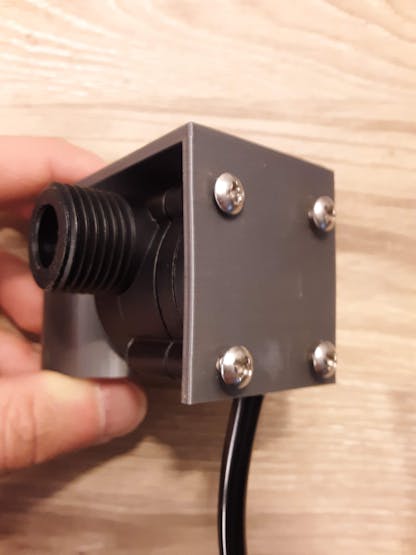
Attach the sensor the the 3D bracket by unscrewing the faceplate screws off the sensor, putting the sensor inside the bracket, and using the same screws to attach it to the bracket wall.
Silicone caulk should be placed around the seems and wire opening of the sensor for added water protection.
Attach the bracket and sensor the to vertical pipe structure and use nylon zip ties to hold the extension wire against the pipe. Place the 3D printed funnel on the mouth of the sensor.
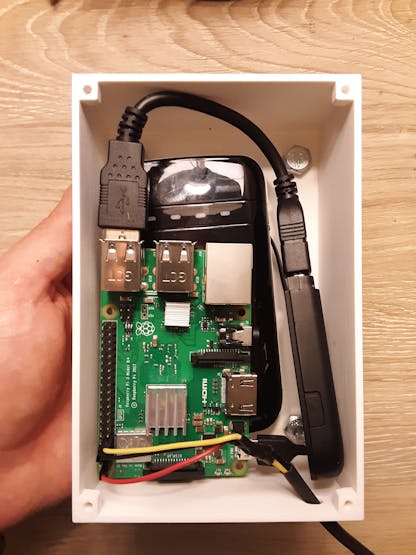
Step 3: Electronics HousingWith the electronics housing 3D printed, attach it to the top of the vertical pipe using the rigid conduit straps and the 1/4" hex bolts and nuts. The bolts will fit through the strap holes on the back face of the housing.
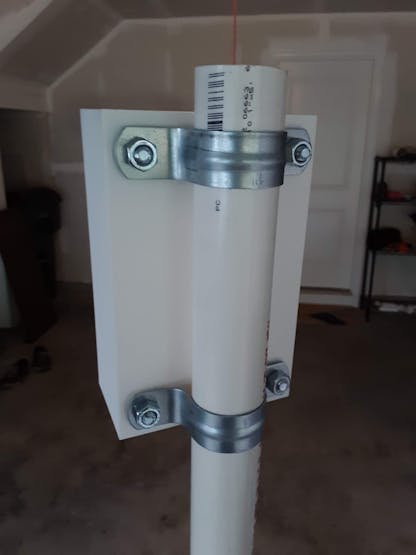
When ready to deploy the sensor, place the Rasberry Pi, Battery, USB extension cable, and 3G USB modem into the housing and power on the Raspberry Pi. Feed the heat-shrunk wiring from the sensor into the hole at the bottom of the housing and make the connections to the Pi's pins.
Use the 4-40 1/2" screws to attach the face plate onto the housing box.
The structure is now ready to be put in a river. Find a spot that allows the housing to remain above the water, and a place with a relatively flat bottom so that the structure can remain stable.
Email NotificationsStep 1: Create New Managed User in AWSBegin by creating a new managed user that will be granted permission to programmatically access AWS IoT. Soracom Funnel will access AWS IoT through this user.
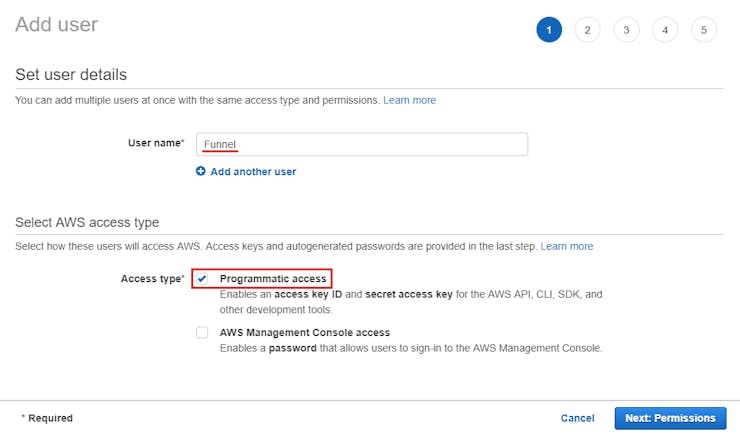
Open the AWS IAM Management Console and click on "Users" in the left menu, then "Add User".Enter a "User name" (ex. Funnel) and check "Programmatic access" in the "Access type" section, then click "Next: Permissions".
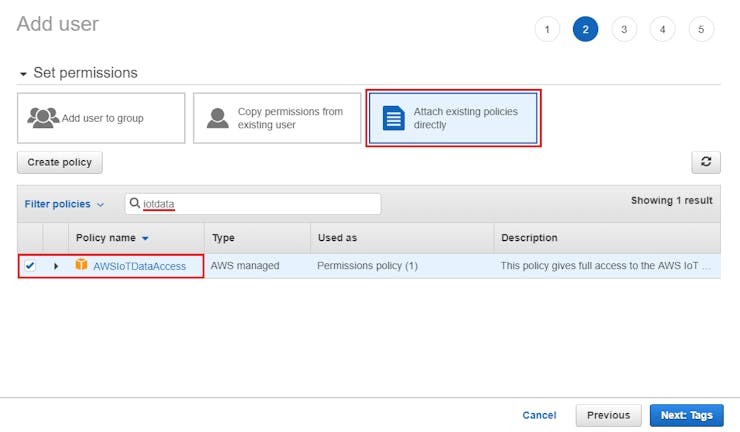
Click on "Attach existing policies directly" and type "iotdata" in search box. From the results, check the "AWSIoTDataAccess" permission. Click "Next: Tags", then "Next: Review", and "Create user" on the following pages.
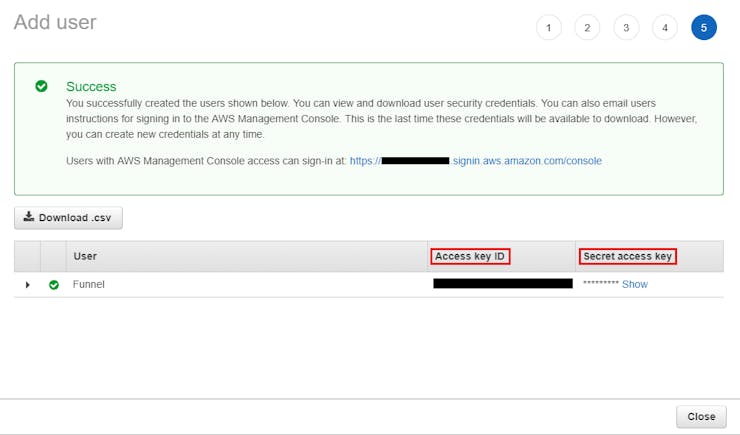
On the following page, copy the "Access key ID" and "Secret access key" to a text file.
 Step 2: Get AWS IoT EndpointOpen the AWS IoT Console and click "Settings" in the left menu. Copy the "Endpoint" URL from the "Custom endpoint" section.
 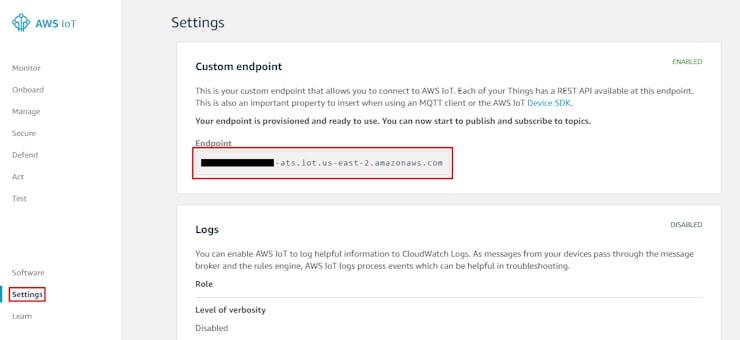 Step 3: Configure Soracom FunnelOpen the Soracom User Console and click on the Group name of the SIM card in use for this project. In the "Soracom Funnel" section, enable the service by click the toggle button to "on".
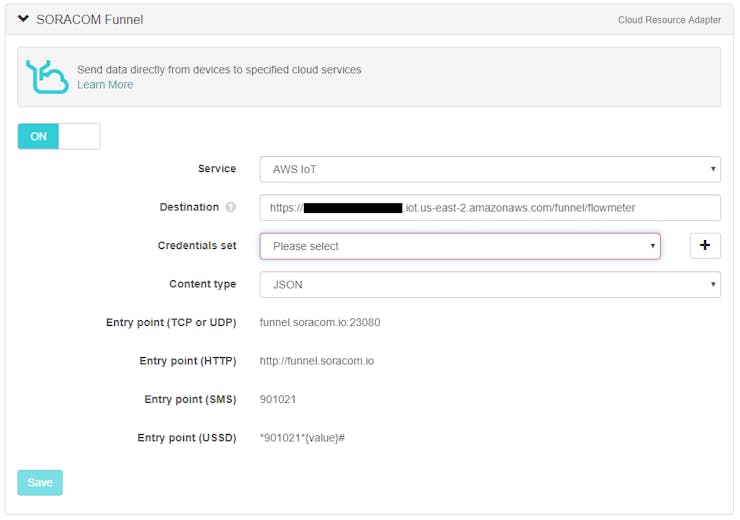
 Select "AWS IoT" as the "Service".
Set the "Destination" as "<your_custom_endpoint>/funnel/flowmeter", substituting the custom url copied from the previous step (no quotation marks). This is the endpoint and AWS topic (funnel/flowmeter) that data will be forwarded to.Click the "+" button to register a new credentials set.
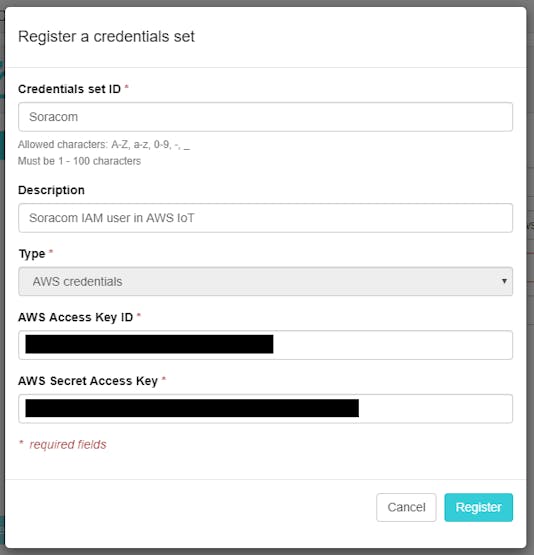
In the popup window set the "Credentials set ID" to new ID (ex. Soracom) and fill out the "Description" (ex. Soracom IAM user in AWS IoT).
Select "AWS credentials" as the "Type" and paste the AWS Access Key ID and AWS Secret Access Key copied from Step 1 into the appropriate fields.
Click the "Register" button.
From the "Credentials Set" dropdown, select the credentials that were just registered (ex. Soracom (Soracom IAM user in AWS IoT)).
Click the "Save" button.
 Step 4: View Data in AWS IoT
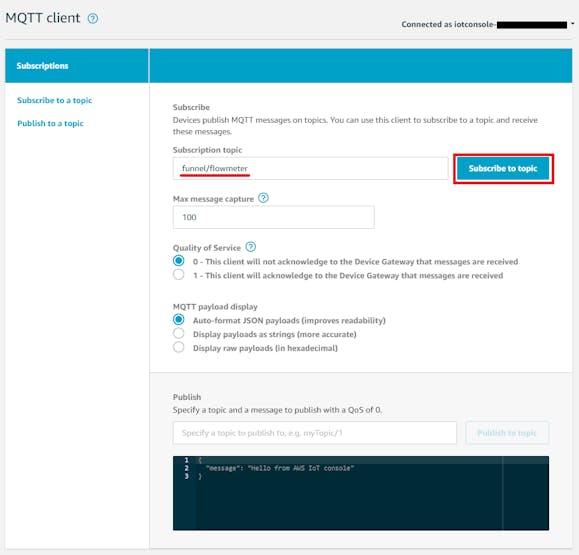
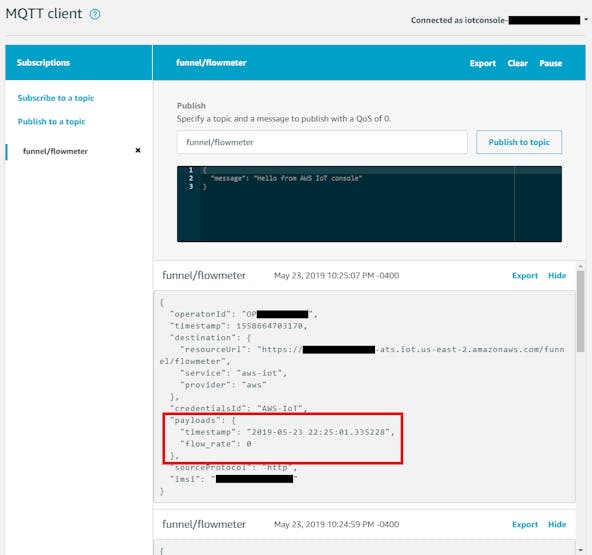
Verify that data is being forwarded to AWS IoT from Soracom Funnel by subscribing to the topic we assigned in the previous step.
Open the AWS IoT Console and click on "Test" in the left menu. In the MQTT client window input "funnel/flowmeter" as the "Subscription topic" and click "Subscribe to topic".Messages published to this topic from Funnel should begin to appear. The messages contain the original payload from the sensor, plus some additional metadata from Soracom.
 Step 5: Send Data to CloudWatch
 The next step is to send this incoming data to AWS CloudWatch as a custom metric. CloudWatch allows for visualization of metrics and notifications.
Open the AWS IoT Console and click on "Act" in the left menu. Click "Create" on the following screen.From the "Create a rule" menu, input a rule "Name" (ex. CloudWatch) and "Description".
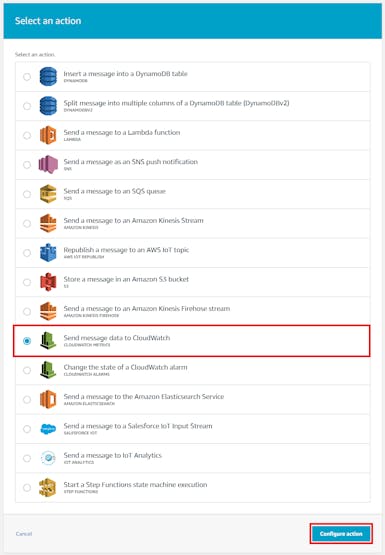
In the "Rule query statement" enter the following statement:SELECT * FROM 'funnel/flowmeter'. This statement will apply this rule to all messages sent to the "funnel/flowmeter" topic. Click "Add action". On the next screen choose "Send message data to CloudWatch" then click "Configure action".
On the next menu fill in the following:
Metric name:flow_rateMetric namespace: flowmeterUnit: NoneValue: ${payloads.flow_rate}Click "Create Role" and type the name of a new role (ex. CloudWatchRole), click "Create Role" again, then use the "Select" button to choose the newly created role from the dropdown menu.
Click the "Add action" button. Theflow_rate data from incoming messages will be forwarded to CloudWatch. 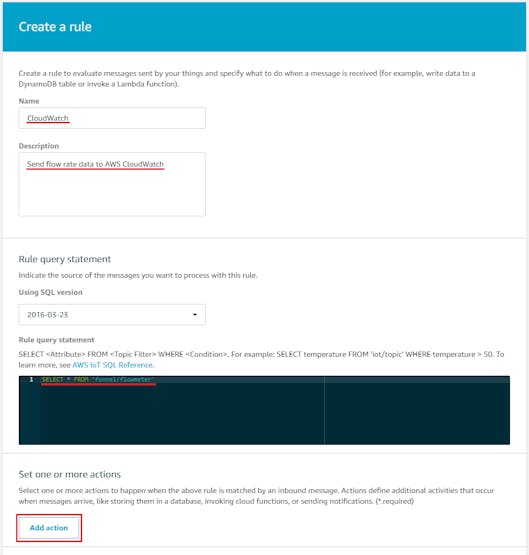
 Step 6: Setup NotificationsOpen the AWS CloudWatch Console click on "Metrics" in the left menu. Under "Custom Namespaces" click "flowmeter".
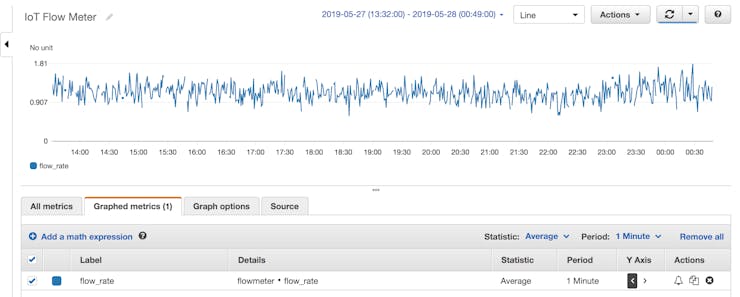
 Click "Metrics with no dimensions", then select "flow_rate". The CloudWatch graph will populate with flow rate values for the selected time window. The graph can be set to auto update so new data will be plotted as it streams in.
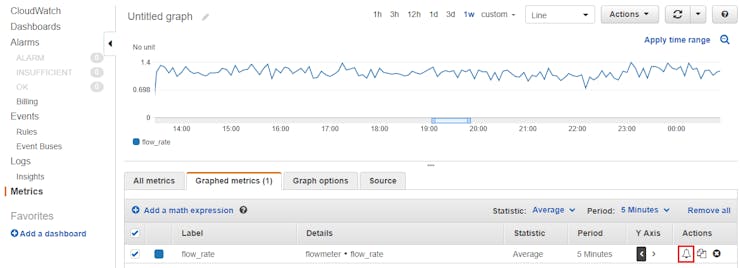
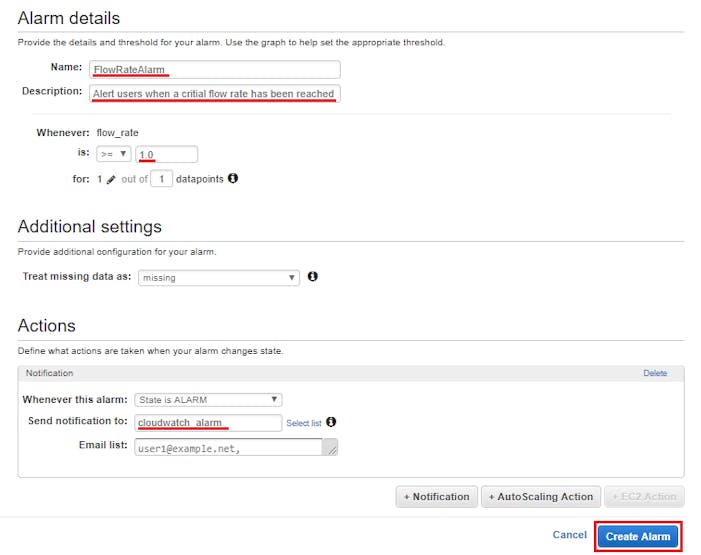
Click the "Bell Icon" to setup an alarm for this metric. On the next screen fill out the alarm "Name" (ex. FlowRateAlarm) and "Description".
The "Alarm details" section defines when the value of the metric is in an alarm state. For this project, that means when the flow_rate reaches a value that is significant to let users know about. For this example a value of 1.0 is chosen, but a more realistic number can be determined by looking at the incoming data to determine what a normal river flow generates as a flow rate, and setting it above that number.
In the "Actions" section select "New List" and type in the name of a new notification list group (ex. cloudwatch_alarm). Select that list and type in any email addresses you want included on this list.
A confirmation email will be sent out to these addresses to confirm their subscription to the notifications.
Click the "Create Alarm" button.
Now that the alarm is created, CloudWatch will continuously monitor incoming data for this metric, and if it crosses into an alarm state (ex. flow_rate >= 1.0) it will send a notification email to subscribed users.